Published
45 mins ago
on
December 8, 2023
| 20 views
-->
By
Tessa Di Grandi
Article & Editing
- Bruno Venditti
Graphics & Design
- Sabrina Fortin
The following content is sponsored by Sprott
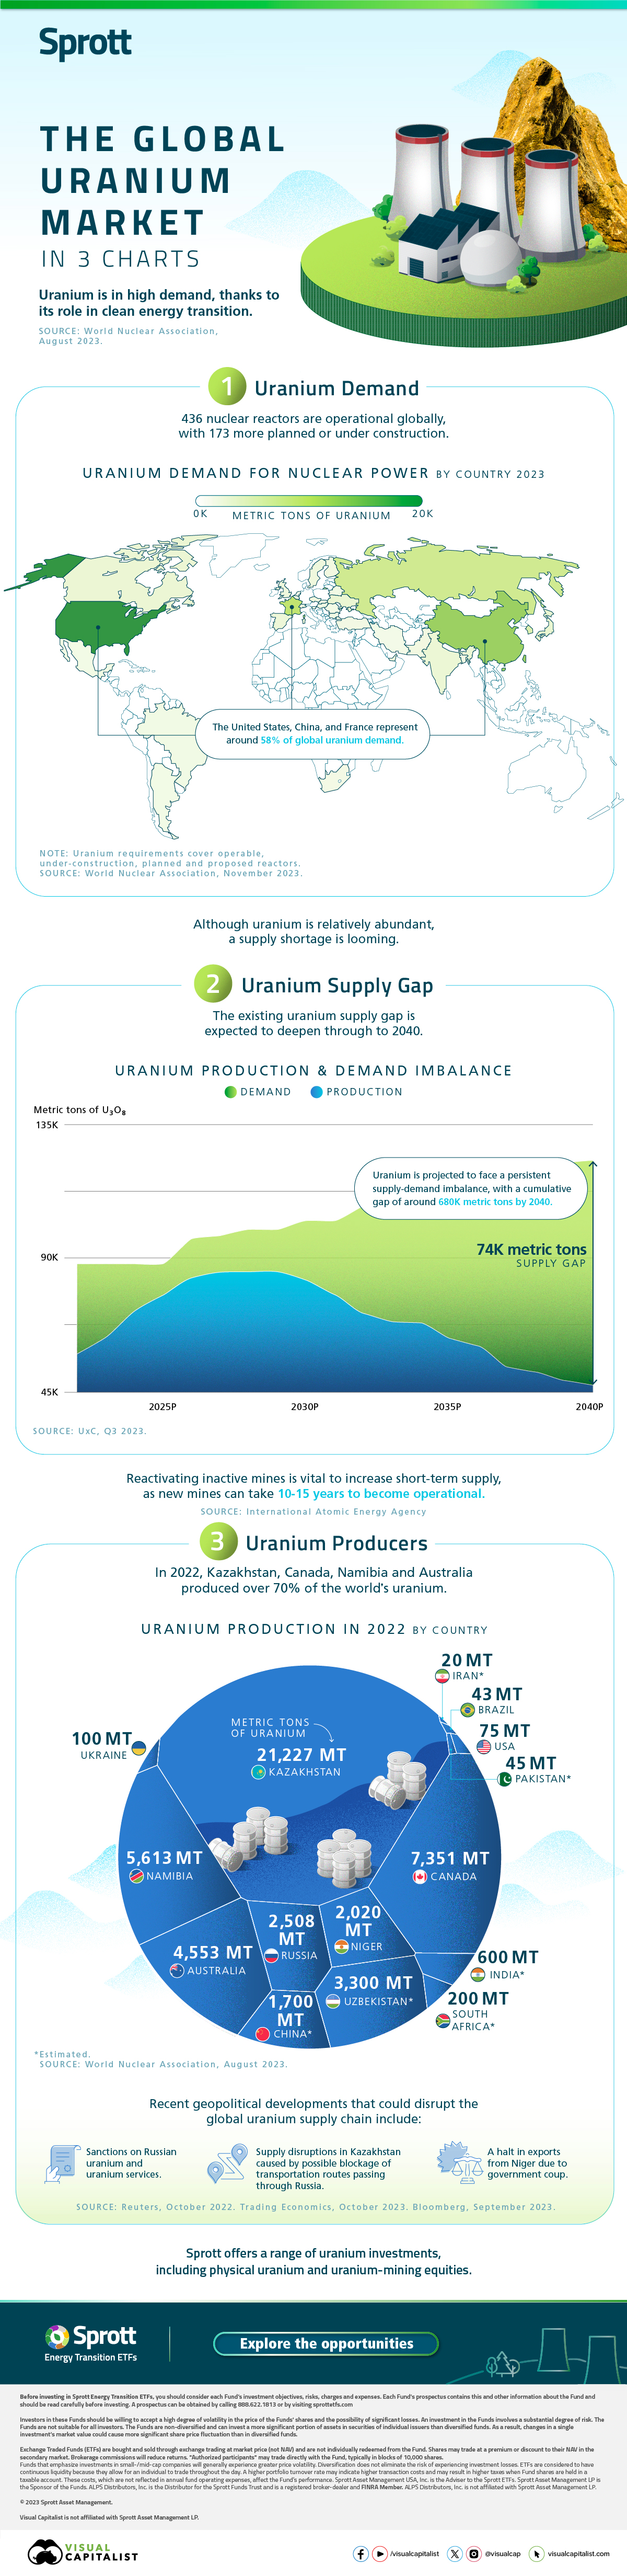
The Global Uranium Market in 3 Charts
The uranium market is experiencing increased demand, driven by its integral role in clean energy generation through its use in nuclear power.
In this graphic, our sponsor Sprott explores three pivotal areas shaping the global uranium landscape.
Uranium Demand
With 436 operational nuclear reactors worldwide and 173 more in the pipeline, the demand for uranium is on the rise.
The United States, China, and France collectively represent approximately 58% of the global uranium demand.
Despite its relative abundance, the looming scarcity of supply poses a significant challenge.
The Uranium Supply Gap
Forecasts project a persistent supply-demand imbalance for uranium, with an anticipated cumulative gap of approximately 680,000 metric tons by 2040.
Meanwhile, the existing supply gap is expected to intensify, signifying a prolonged shortage in the market.
| Millions of U3O8 lbs | Production | Demand | Gap |
|---|---|---|---|
| 2022 | 129 | 194 | 65 |
| 2023P | 142 | 195 | 53 |
| 2024P | 160 | 196 | 36 |
| 2025P | 172 | 198 | 26 |
| 2026P | 184 | 208 | 24 |
| 2027P | 188 | 213 | 25 |
| 2028P | 189 | 217 | 28 |
| 2029P | 190 | 221 | 31 |
| 2030P | 185 | 223 | 38 |
| 2031P | 174 | 226 | 52 |
| 2032P | 158 | 235 | 77 |
| 2033P | 154 | 242 | 88 |
| 2034P | 150 | 249 | 99 |
| 2035P | 139 | 253 | 114 |
| 2036P | 135 | 255 | 120 |
| 2037P | 118 | 257 | 139 |
| 2038P | 114 | 260 | 146 |
| 2039P | 108 | 269 | 161 |
| 2040P | 106 | 270 | 164 |
To bridge the immediate supply deficit, reactivating dormant mines becomes crucial, considering the extensive timeline of 10-15 years for new mines to become operational.
Uranium Producers
In 2022, Kazakhstan, Canada, Namibia, and Australia were responsible for over 70% of the global uranium production.
However, recent geopolitical developments threaten disruptions in the uranium supply chain, including:
- Potential sanctions on Russian uranium and related services.
- Risks of supply interruptions in Kazakhstan due to transportation routes passing through Russia.
- Halts in uranium exports from Niger following government coups.
Despite these risks, the demand for uranium in nuclear reactors is projected to escalate over the next decade, increasing by 28% by 2030 and anticipated to nearly double by 2040.
The surge will be driven by governments scaling up nuclear power capacity to achieve zero-carbon targets.
![]()
Explore Sprott’s range of uranium investments, including physical uranium and uranium-mining equities.

Please enable JavaScript in your browser to complete this form.Enjoying the data visualization above? *Subscribe
Related Topics: #mining #canada #energy #uranium #australia #Russia #clean energy #energy transition #Kazakhstan #sprott
Click for Comments
var disqus_shortname = "visualcapitalist.disqus.com";
var disqus_title = "The Global Uranium Market in 3 Charts ";
var disqus_url = "https://www.visualcapitalist.com/sp/the-global-uranium-market-in-3-charts/";
var disqus_identifier = "visualcapitalist.disqus.com-162878";
You may also like
-

Automotive7 days ago
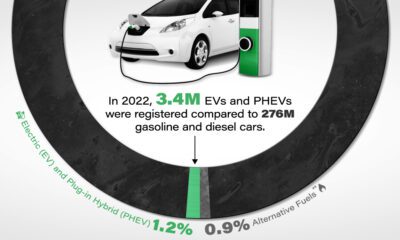
Ranked: Electric Vehicle Sales by Model in 2023
Today, electric vehicle sales make up 18% of global vehicle sales. Here are the leading models by sales as of August 2023.
-

Energy1 week ago
Visualizing the Top Energy Priorities of Major Countries
This infographic lists the top energy priorities in 28 countries, based on an Ipsos survey involving 24,000 people.
-
Automotive2 weeks ago
Visualized: EV Market Share in the U.S.
Although sales have been climbing, EV market share in the U.S. remains low as a percentage of all vehicles registered on the road.
-

Energy1 month ago
Progress on 2030 Renewable Energy Targets by Country
In this graphic, we visualize whether major electricity-consuming countries are on track to meet their 2030 renewable energy targets.
-
Oil and Gas1 month ago
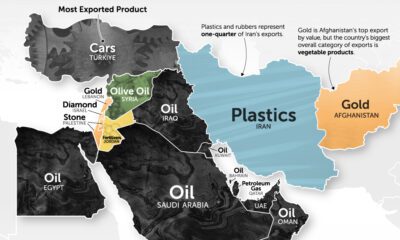
Mapped: The Top Middle East Exports by Country
It’s more than just oil. This map of Middle East exports shows the top global product of each country by value.
-
Energy1 month ago
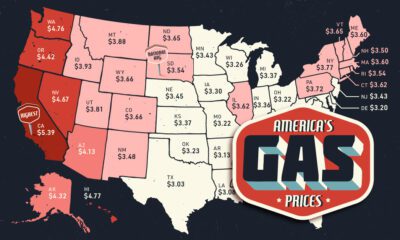
Mapped: Gas Prices in Every U.S. State
Gas prices fluctuate from state to state due to factors such as local taxes, environmental regulations, and the proximity of refineries.
Subscribe
Please enable JavaScript in your browser to complete this form.Join the 375,000+ subscribers who receive our daily email *Sign Up
The post The Global Uranium Market in 3 Charts appeared first on Visual Capitalist.