Via Dana Lyons' Tumblr,
A key index of oil stocks has moved back above its (temporarily broken) 30-year up trendline…for now.
“If the XOI can reclaim that broken trendline, perhaps it can once again serve as support for the oil stock index as it did for 30 years. Not to mention, it would look like a compelling “false breakdown”. These factors could serve as a springboard to a major, sustainable rally in oil stocks.” - March 8 post: The Line In The (Oil) Sand
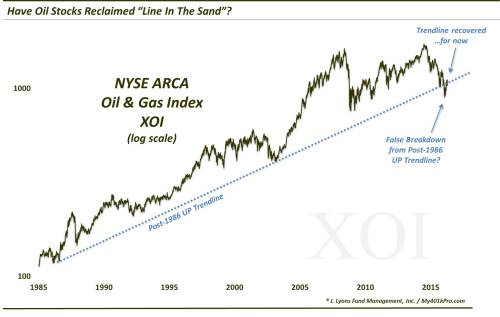
As modern trendlines go, the 30-year up trendline in the NYSE Oil & Gas Index, a.k.a., XOI, is among the most prolific (behind perhaps only the decades-long down trendlines in 30-year U.S. treasury yields and the Japanese Nikkei 225.) The uptrend in the XOI (on a log scale) began just after the inception of the index in 1986 and connects the 2003 lows and the lows of last August, September and December. The trendline was finally broken in January, paving the way for an 18% plunge in about 2 weeks.
Subsequently, the XOI bounced back to test the underside of the trendline, prompting our March 8 post. In the post, we suggested that those trying to decipher whether or not oil stocks had bottomed might be well served to simply focus on whether the XOI could reclaim its broken trendline or not. If not, expect continued weakness with potential further new lows. If it was successful in reclaiming the line, then the bullish potential was considerable, as mentioned in the opening paragraph. As of yesterday, it appears as if the XOI has reclaimed its broken 30-year uptrend.
Now does this mean you go all-in oil stocks and forget about them for 5 years? Of course not. For one, we don’t ever recommend leaving any investment unattended without some form of risk controls standing by. Secondly, despite the recovered trendline, there remain some shorter-term challenges for the XOI nearby. Specifically, the index is now testing its post-2014 down trendline, also on a log scale. On top of that is the 200-day moving average and an assortment of key Fibonacci Retracement lines from the key tops over the past few years as shown in this chart.
[image]https://41.media.tumblr.com/8c9f6c189697ebe954f5067048cbd7ae/tumblr_inline_o5le2cpRK91sq14jh_500.jpg[/image]
So the reclaimed 30-year trendline is not a be-all and end-all. It could fall back below the line again as it did last month. Furthermore, the fact that it has broken the line likely means the trendline has been softened up a bit. However, for objectivity’s sake it may be the best decision-maker available for those traders/investors considering jumping (back) into oil stocks – or those still waiting to cut their losses.
Whatever the case may be, the line is relevant on a 30-year basis so it carries significant weight. At the very least, it provides a clear line in the sand nearby to trade against. And if the XOI decides to remain above that line in the sand, oil bulls may finally get their long awaited recovery.
* * *
More from Dana Lyons, JLFMI and My401kPro.