Written By Bruno Venditti
Graphics & Design
- Alejandra Dander
Published September 13, 2022
•
Updated September 13, 2022
•
TweetShareShareRedditEmail
The following content is sponsored by Northstar Clean Technologies
One Year of Global Waste Visualized
Waste generation is expected to jump to 3.4 billion tonnes over the next 30 years, compared to 2.2 billion in 2019.
This is due to a number of factors, such as population growth, urbanization, and economic growth.
In this graphic by Northstar Clean Technologies, we show waste generation worldwide and discuss its impact and how it can be reduced.
The Growing Pile of Global Waste
The United States is the world’s most wasteful country, with each American producing a whopping 809 kg (1780 lbs) of waste every year.
Approximately half of the country’s yearly waste will meet its fate in one of the more than 2,000 active landfills across the nation. The country also has the largest landfill in the world, Apex, located in Clark County, Nevada.
The United States is followed by other industrialized countries like Denmark, New Zealand, Canada, and Switzerland based on average annual per capita municipal waste generation.
| Country | Average Annual per Capita Municipal Waste Generation (kg) |
|---|---|
| United States | 809 |
| Denmark | 781 |
| New Zealand | 727 |
| Canada | 706 |
| Switzerland | 706 |
| Iceland | 656 |
| Israel | 644 |
| Germany | 633 |
| Ireland | 616 |
| Luxembourg | 607 |
| Austria | 570 |
| Australia | 560 |
| France | 514 |
| Netherlands | 513 |
| Finland | 510 |
| Greece | 504 |
| Italy | 489 |
Compared to those in developed nations, residents in developing countries are more severely impacted by unsustainably managed waste. In low-income countries, over 90% of waste is often disposed of in unregulated dumps or openly burned, according to the World Bank.
In this scenario, the need for authorities to provide adequate waste treatment has become ever more important. However, less than 20% of waste is recycled each year, with huge quantities still sent to landfill sites.
Repurposing Waste
One of the major sources of waste is the construction industry. Every year, around 12 million tons of used asphalt shingles are dumped into landfills across North America.
Similar to roads, asphalt shingles have oil as the primary component, which is especially harmful to the environment.
However, using technology, the primary components in shingles can be repurposed into liquid asphalt, aggregates, and fiber for use in road construction, embankments, and new shingles.
Providing the construction industry with clean, sustainable processing solutions is also a big business opportunity. Canada alone is a $1.3 billion market for recovering and reprocessing shingles.
Even though 100% zero waste may sound difficult to achieve in the near future, a zero waste approach is essential to reduce our impact on the environment.
Northstar Clean Technologies’ mission is to be the leader in the recovery and reprocessing of asphalt shingles in North America.

Please enable JavaScript in your browser to complete this form.Subscribe to our free newsletter and get your mind blown on a daily basis: *Sign up
Related Topics: #waste #garbage #planet #global waste #landfill #landfill crisis #construction waste #Northstar Clean Technologies #garbage management
Click for Comments
var disqus_shortname = "visualcapitalist.disqus.com";
var disqus_title = "One Year of Global Waste Visualized";
var disqus_url = "https://www.visualcapitalist.com/sp/one-year-of-global-waste-visualized/";
var disqus_identifier = "visualcapitalist.disqus.com-152236";
You may also like
-

Technology4 days ago
iPhone Now Makes Up the Majority of U.S. Smartphones
Apple’s flagship device has captured a modest 16% of the global market, and Android dominates globally. Why do so many Americans keep buying iPhones?
-
Datastream4 days ago
Ranked: The Top Cyberattacks Against Businesses
Recent research provides insight into the top cyberattacks that businesses faced in 2021. See the results in this infographic.
-

Money5 days ago
Charting the Relationship Between Wealth and Happiness, by Country
Can money really buy happiness? In this chart, we compare most of the world’s countries to examine the relationship between wealth and happiness.
-
VC+5 days ago
Join Us as We Explore The World at 8 Billion
Dive into how the world’s growing population will shape the future. Join VC+ to gain exclusive access to The World at 8 Billion series.
-
Money6 days ago
Mapped: A Snapshot of Wealth in Africa
Total private wealth in Africa is now estimated to be US$2.1 trillion. This map looks at where all that wealth is concentrated around the continent.
-
Energy1 week ago
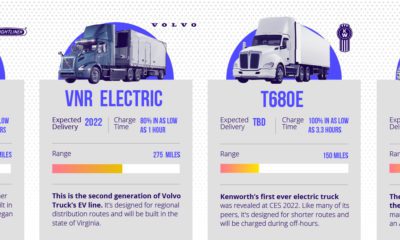
All Electric Semi Truck Models in One Graphic
A wave of electric semi trucks is expected to arrive over the next few years. View this infographic to learn more.
Subscribe
Please enable JavaScript in your browser to complete this form.Join the 300,000+ subscribers who receive our daily email *Sign Up
The post One Year of Global Waste Visualized appeared first on Visual Capitalist.