 Silver Bullion Market Has Key New Player – China Replaces JP Morgan
The silver bullion market has a key new player – Enter the Dragon. The Shanghai Futures Exchange in China is replacing JP Morgan bank and its clients as the most significant new source of demand according to a very interesting blog with some great charts and tables published by SRSrocco Report yesterday.
According to the report:
The days of JP Morgan controlling the silver market may be numbered as a new player in the silver market has arrived. For the past several years, JP Morgan held the most silver on a public exchange in the world. While the LBMA may hold (or did hold) more silver, their stockpiles are not made public.
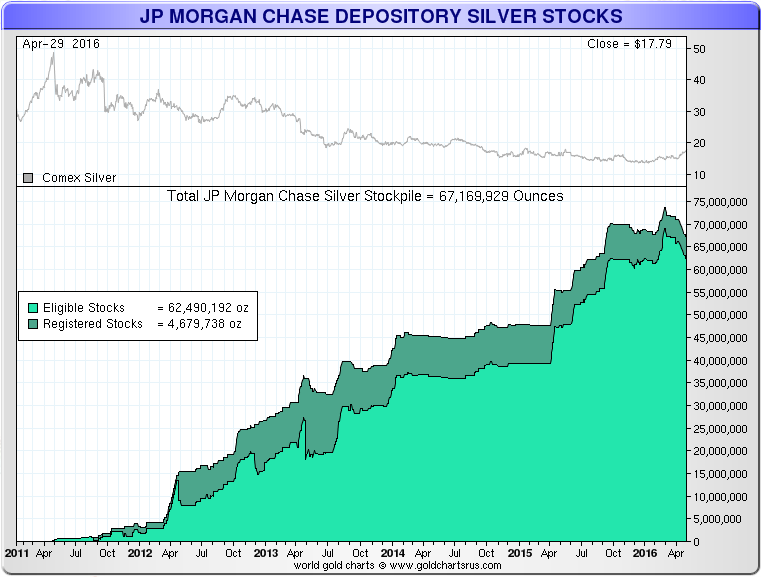
Regardless, JP Morgan held the most silver at nearly 74 million oz (Moz) in its warehouse, up until recently. Over the past two month, JP Morgan’s silver inventories have fallen nearly 7 Moz to 67.1 Moz today:
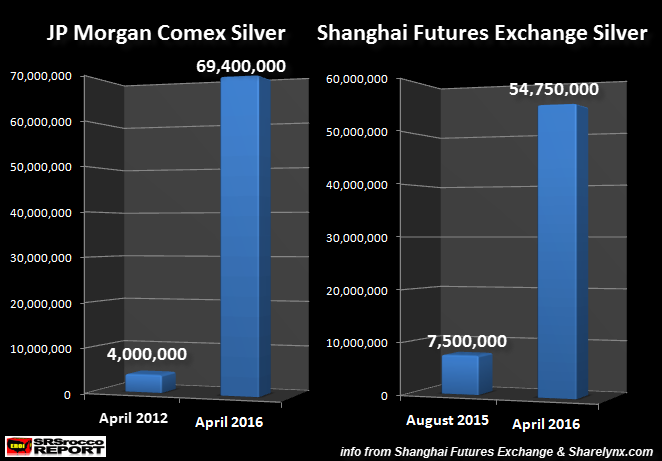
As I mentioned in my previous article, Why Are The Chinese Stockpiling Silver? Big Move Coming?, JP Morgan increased their silver inventories from 4 Moz in April 2011 to 69.4 Moz April 19, 2016. However, the Shanghai Futures Exchange silver inventories surged from 7.5 Moz in August 2015 to 54.7 Moz on April 19, 2016:
Basically, JP Morgan added an average 16.3 Moz of silver each year for the past years, whereas the Shanghai Futures Exchange added nearly 7 Moz per month. Furthermore, the majority of gains came since the beginning of 2016. Again, here is my previous Shanghai Futures Exchange silver stock chart from the article linked above:
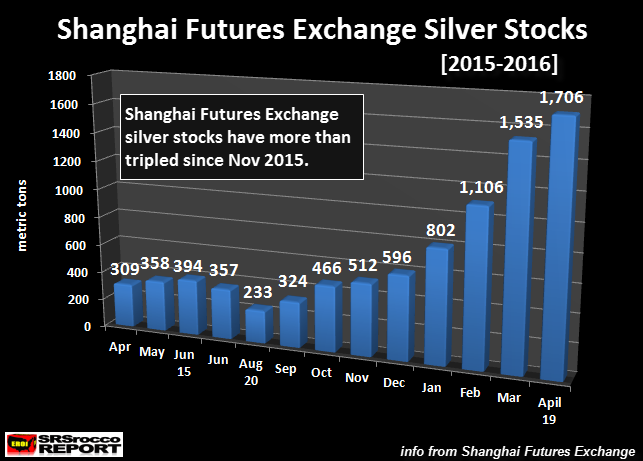
As we can see from this chart dated April 19th, the Shanghai Futures Exchange more than tripled their silver inventories since November 2015. What is even more interesting is the continued buildup over the past two weeks. Here is an updated chart based on data for May 3rd:
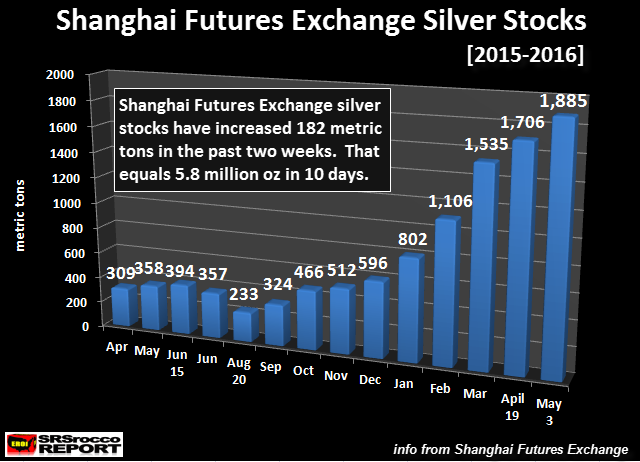
Over the past two weeks, the Shanghai Futures Exchange added another 179 metric tons (mt) or 5.8 Moz. Now, if we update the JP Morgan and Shanghai Futures Exchange silver stock chart (from above) we have the following:
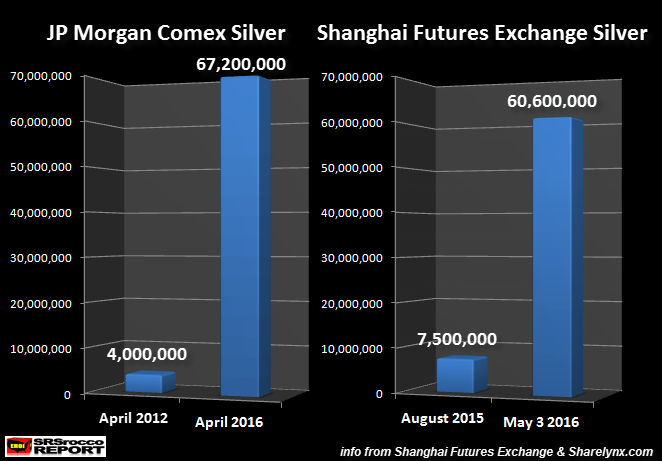
Here we can see that JP Morgan’s total silver inventories have declined from 69.4 Moz to 67.2 Moz, while the Shanghai Futures Exchange silver stocks have increased from 54.7 Moz to 60.6 Moz. If the Shanghai Futures Exchange continues to add silver at this rate, it will surpass JP Morgan in a two to three weeks.
Comex Registered Silver Inventories Drop Nearly 4 Million Ounces Yesterday
When the CME Group published the recent silver inventory change on the Comex yesterday, nearly 4 Moz were transferred from the Registered to Eligible Category. The majority of the transfer came from the CNT Depository at nearly 3.5 Moz with 485,325 oz from HSBC:
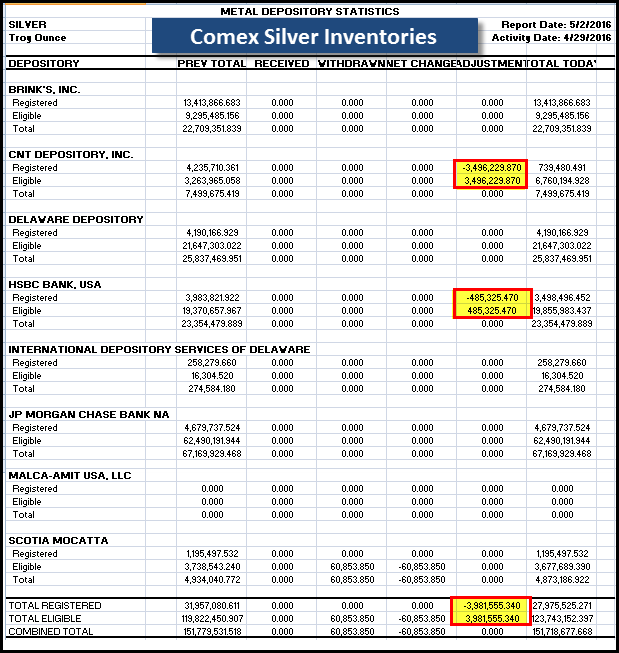
Some analysts say these transfers really don’t mean much if the overall inventories stay the same. That may be true, but there was some reason the CNT Depository transferred 3.5 Moz of silver from their Registered Inventories to the Eligible.
That being said, the Chinese are adding a lot of silver to their Shanghai Futures Exchange warehouses. The build from 7.5 Moz in August 2015 to over 60 Moz of silver in the beginning of May puts JP Morgan’s four-year inventory growth to shame.
For whatever reason, silver inventories at the Shanghai Futures Exchange warehouses are increasing at a rapid pace while the Comex silver stocks continue to decline. Comex silver inventories were over 180 Moz in July 2015 and are now only 151 Moz. This is quite interesting as the Shanghai Futures Exchange inventories started to build from 7.5 Moz in August 2015 to the 60.6 Moz today.
It will be interesting to see how the exchange inventories and price action of silver play out over the next several months.
Enter the Dragon ! See SRSrocco report here
Week’s Market UpdatesIs Craig Wright The Creator Of Bitcoin? Frisby and Matonis On ‘Satoshi Nakamoto’
Gold “Chart of The Decade” – Maths Suggest $10,000 Per Ounce Says Rickards
Property Bubble In Ireland Developing Again
Silver Bullion “Momentum Building” As “Supply Trouble Brewing”
Gold News and CommentaryInvestors Boost Gold Assets in World’s Top ETF by Most Since `11 (Bloomberg) Gold hovers below 15-mth peak as dollar firms on US rate talk (Reuters) Gold at Two-Year High Smothers Demand in Second-Biggest User (Bloomberg) Gold snaps 6-session win streak as dollar rises (Marketwatch) Global factory growth nearly stalled in April: PMI (Reuters)
Japan’s Abenomics ‘dead in the water’ after US currency warnings (Telegraph) Central banks conspire to harvest Bitcoin’s revolutionary technology (Telegraph) True fascination of bitcoin is not its mystery inventor (Guardian) Brink of economic collapse — How did this happen? (Profit Confidential) What comes next – Krugman’s fiscal equivalent of war (Stockman)Read More Here
Gold Prices (LBMA) 04 May: USD 1,280.30, EUR 1,114.18 and GBP 883.59 per ounce 03 May: USD 1,296.50, EUR 1,118.15 and GBP 881.32 per ounce 29 April: USD 1,274.50, EUR 1,119.45 and GBP 873.80 per ounce 28 April: USD 1,256.60, EUR 1,106.45 and GBP 861.43 per ounce 27 April: USD 1,244.75, EUR 1,100.79 and GBP 853.58 per ounce
Silver Prices (LBMA)04 May: USD 17.85, EUR 15.29 and GBP 11.92 per ounce (To be updated) 03 May: USD 17.85, EUR 15.29 and GBP 11.92 per ounce 29 April: USD 17.85, EUR 15.29 and GBP 11.92 per ounce 28 April: USD 17.35, EUR 15.29 and GBP 11.92 per ounce 27 April: USD 17.34, EUR 15.34 and GBP 11.87 per ounce 26 April: USD 16.95, EUR 15.02 and GBP 11.64 per ounce
www.GoldCore.com