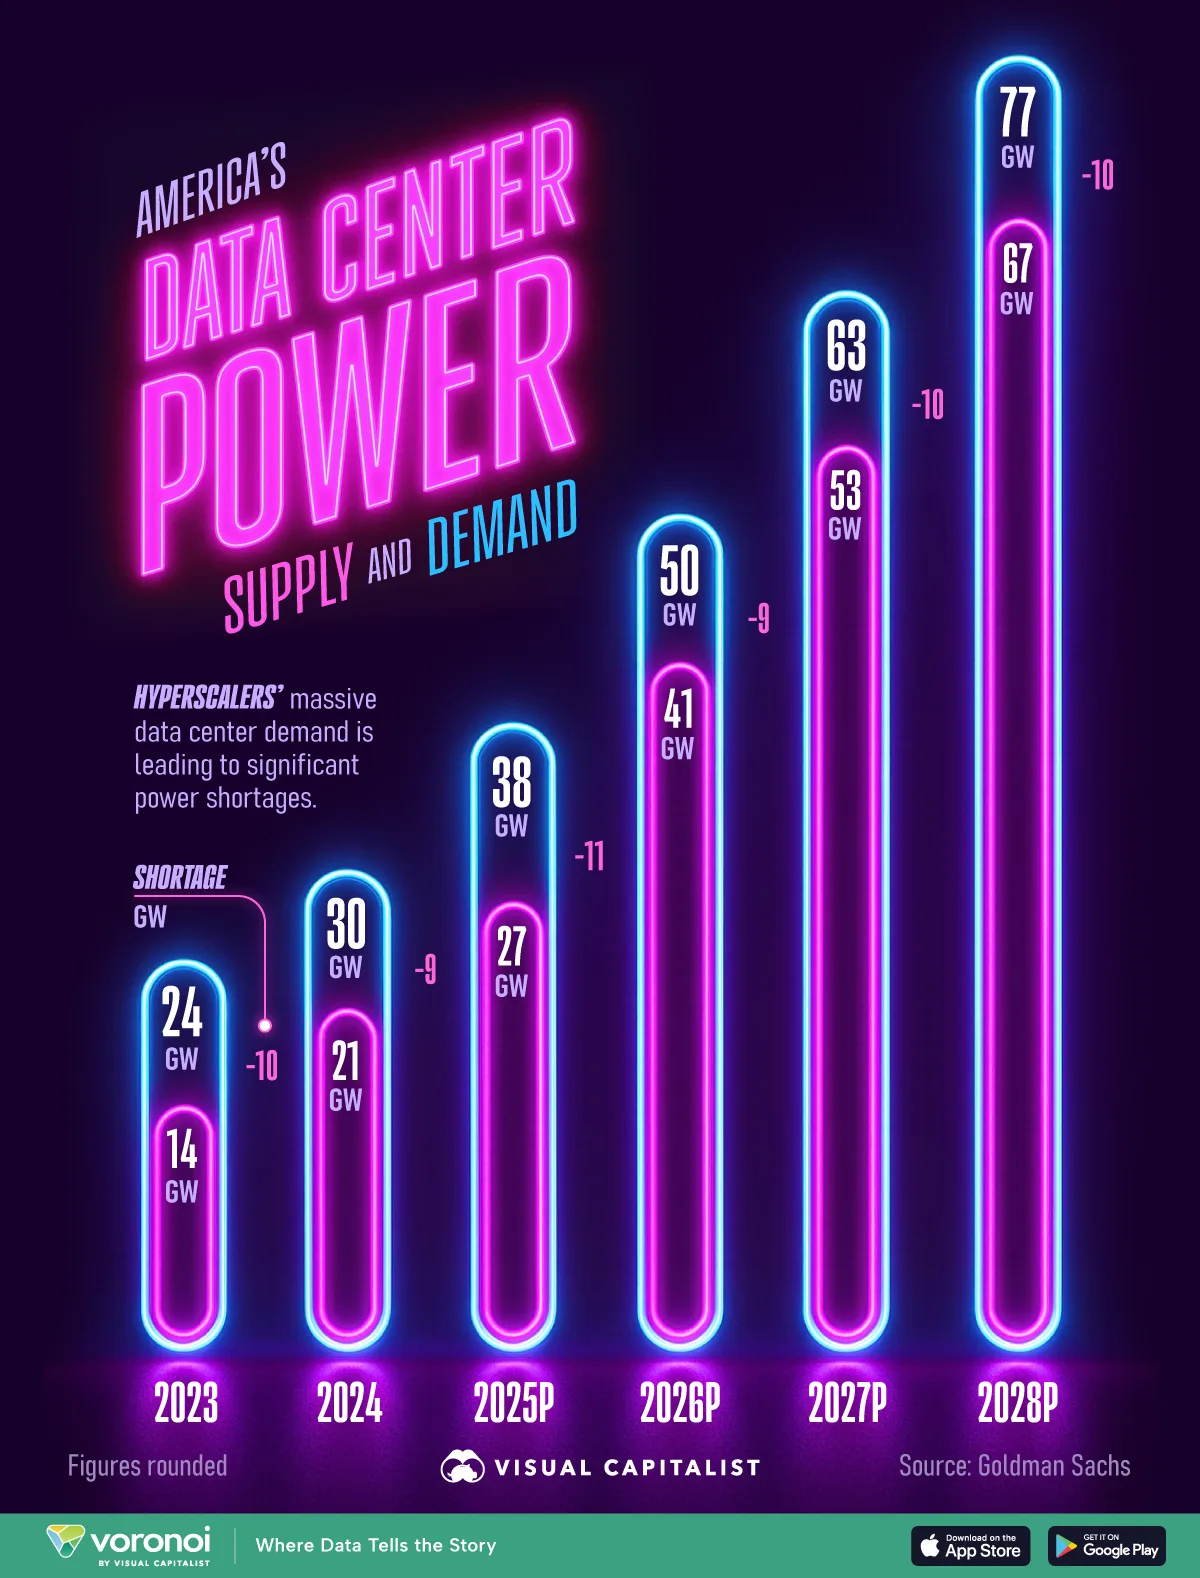
Charted: The Shortage of U.S. Data Center Capacity (2023–2028P)
![]()
See more visualizations like this on the Voronoi app.

Use This Visualization
America’s Data Center Capacity Shortfall
See visuals like this from many other data creators on our Voronoi app. Download it for free on iOS or Android and discover incredible data-driven charts from a variety of trusted sources.
Key Takeaways
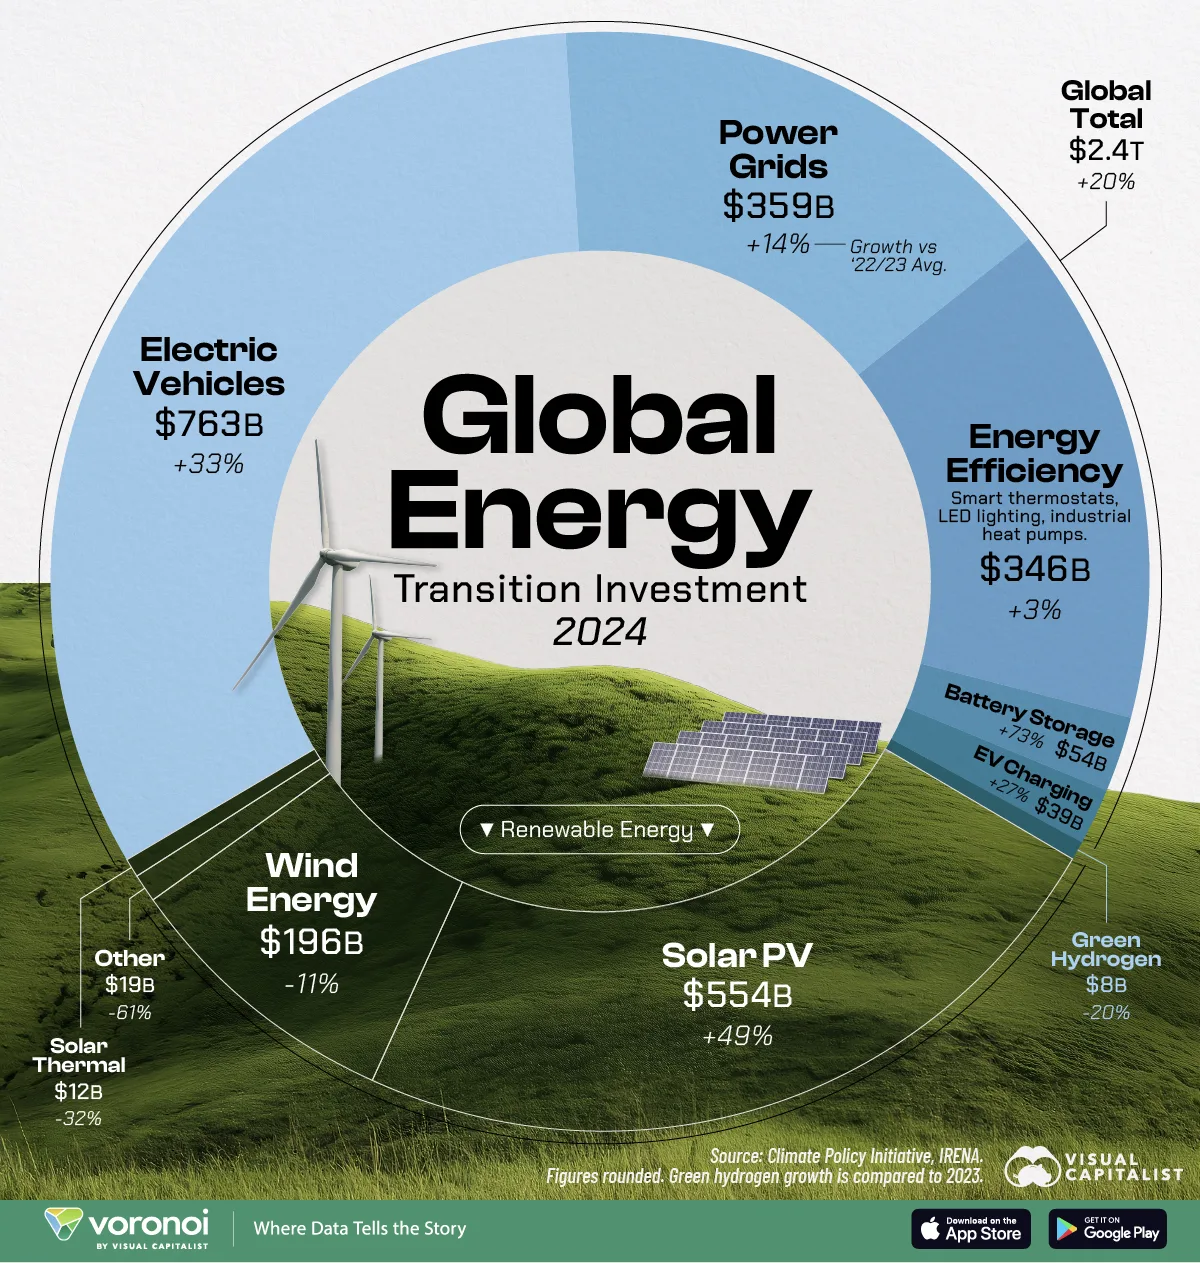
Charted: $2.4 Trillion in Energy Transition Spending, by Category
![]()
See more visualizations like this on the Voronoi app.

Use This Visualization
Visualizing $2.4 Trillion in Energy Transition Spending
See visuals like this from many other data creators on our Voronoi app. Download it for free on iOS or Android and discover incredible data-driven charts from a variety of trusted sources.
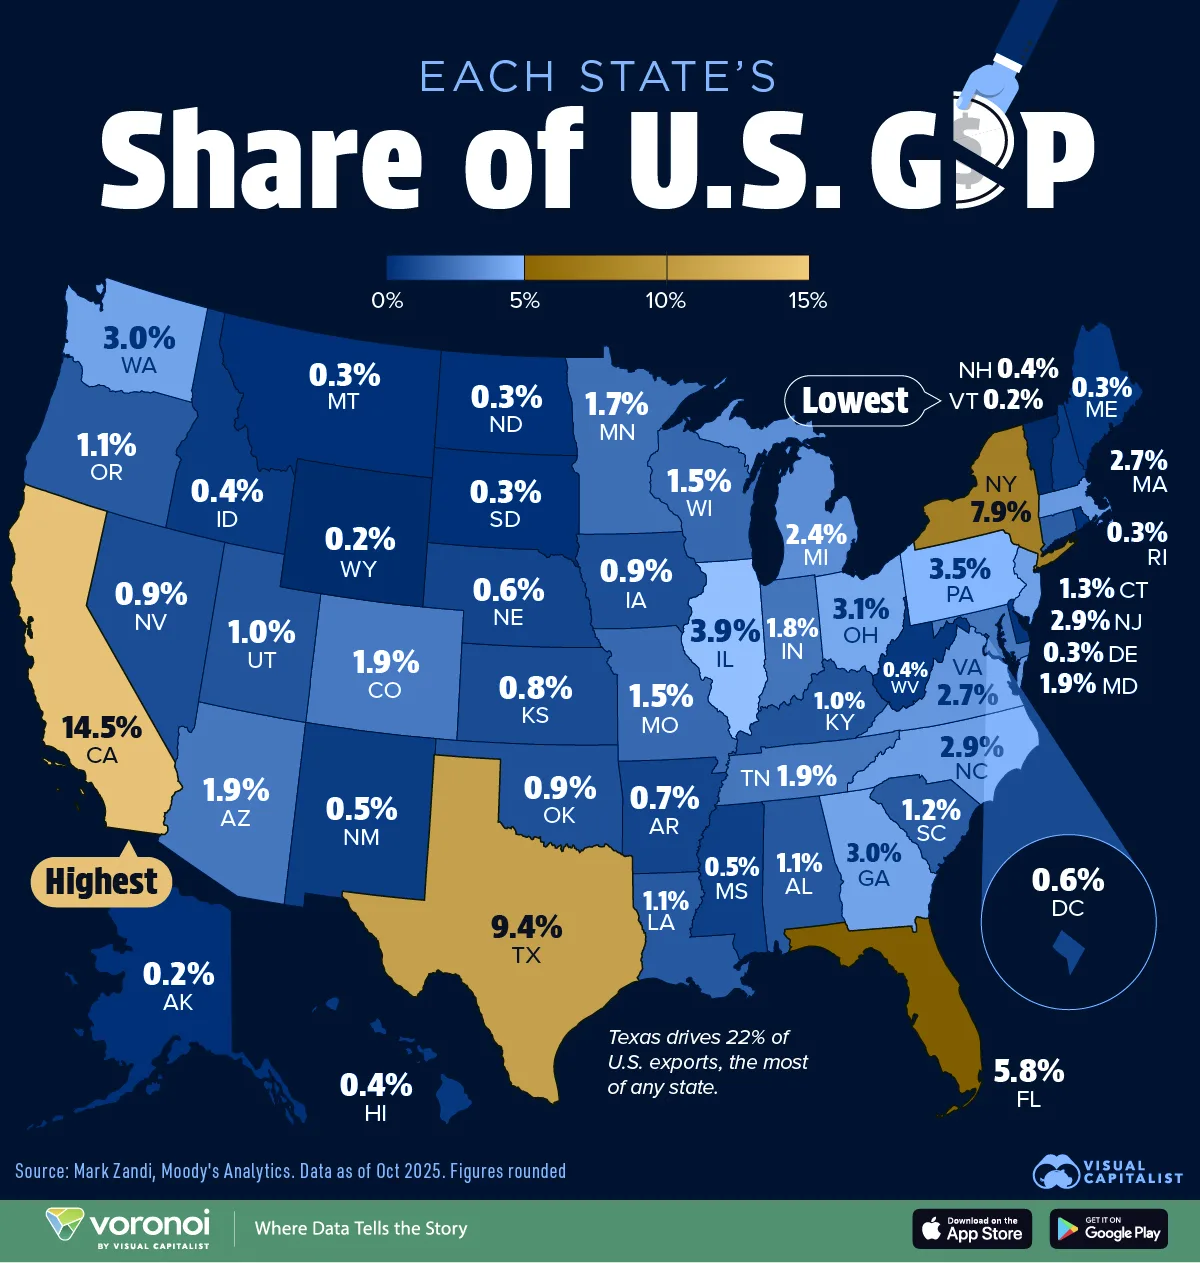
Mapped: Every State’s Share of U.S. GDP
![]()
See more visuals like this on the Voronoi app.

Use This Visualization
Mapped: Every State’s Share of U.S. GDP
See visuals like this from many other data creators on our Voronoi app. Download it for free on iOS or Android and discover incredible data-driven charts from a variety of trusted sources.
Key Takeaways