Is A Much Deadlier Strain Of Monkeypox Going To Be The Next Great Global Health Scare?


![]()
See this visualization first on the Voronoi app.

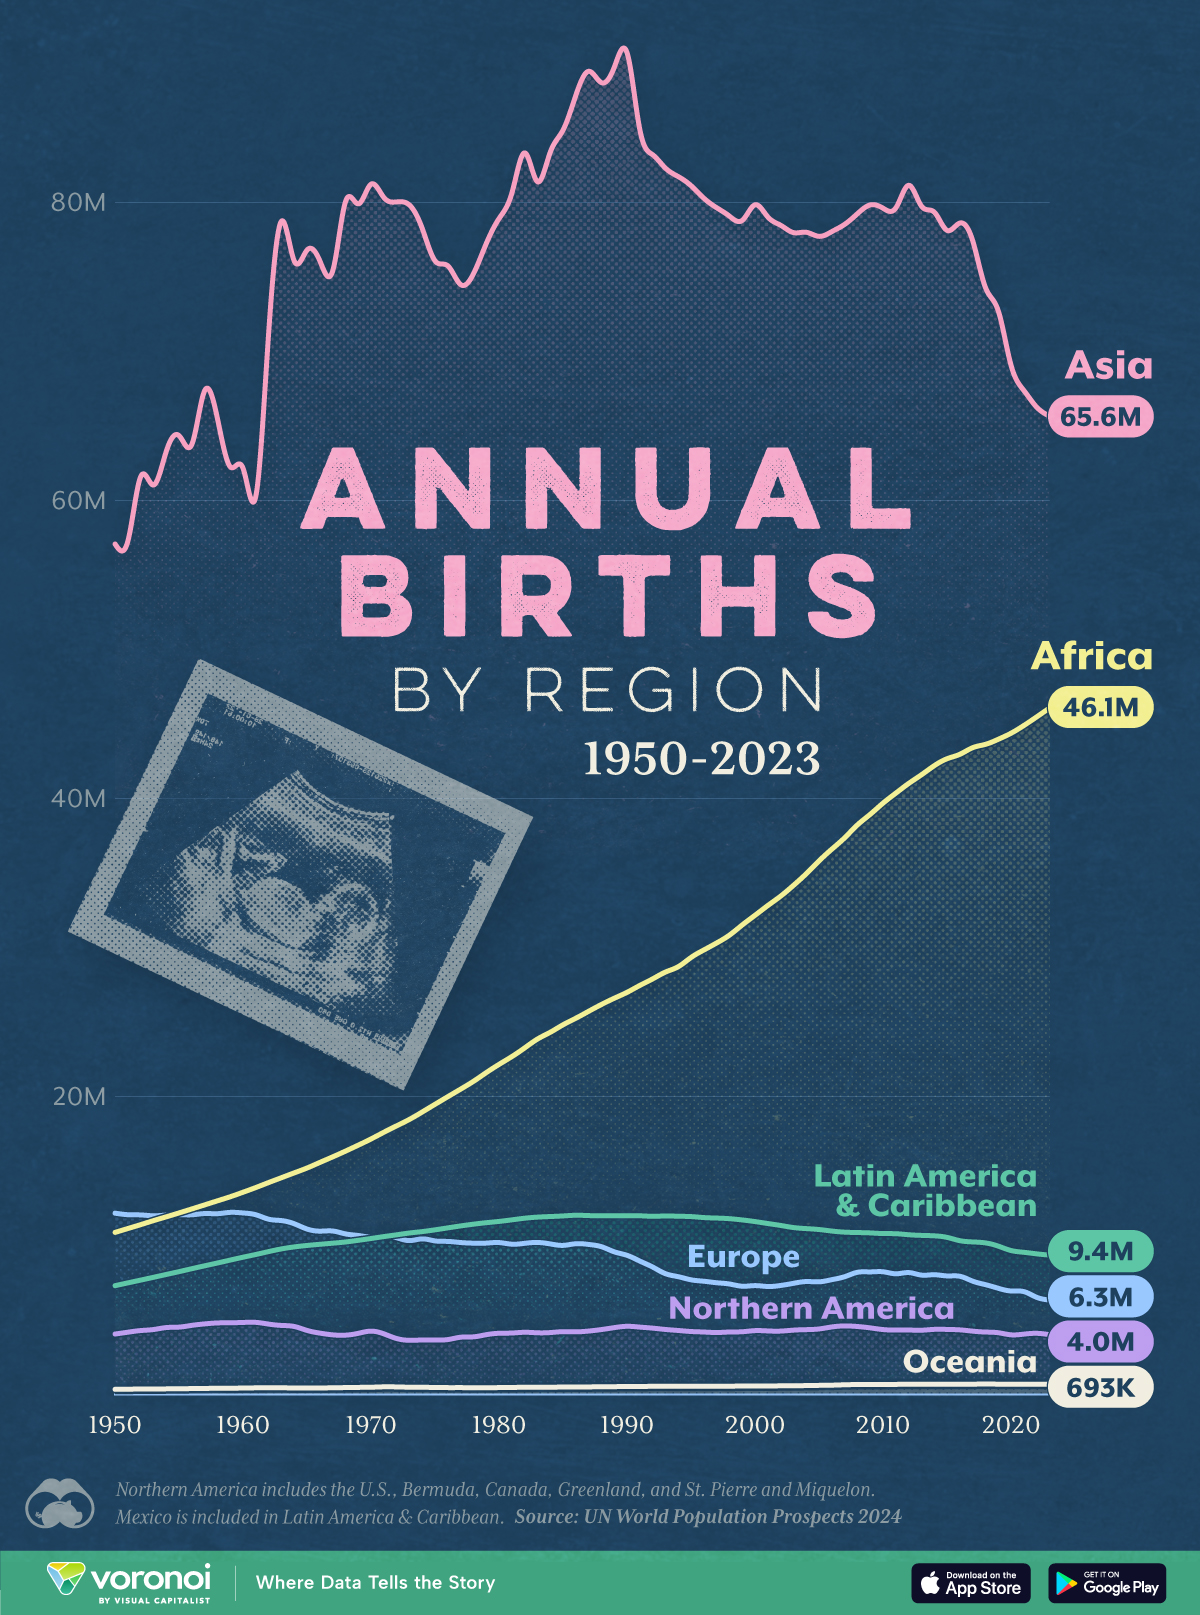
The Number of People Born Every Year, by Region (1950–2023)
This was originally posted on our Voronoi app. Download the app for free on iOS or Android and discover incredible data-driven charts from a variety of trusted sources.
![]()
See this visualization first on the Voronoi app.

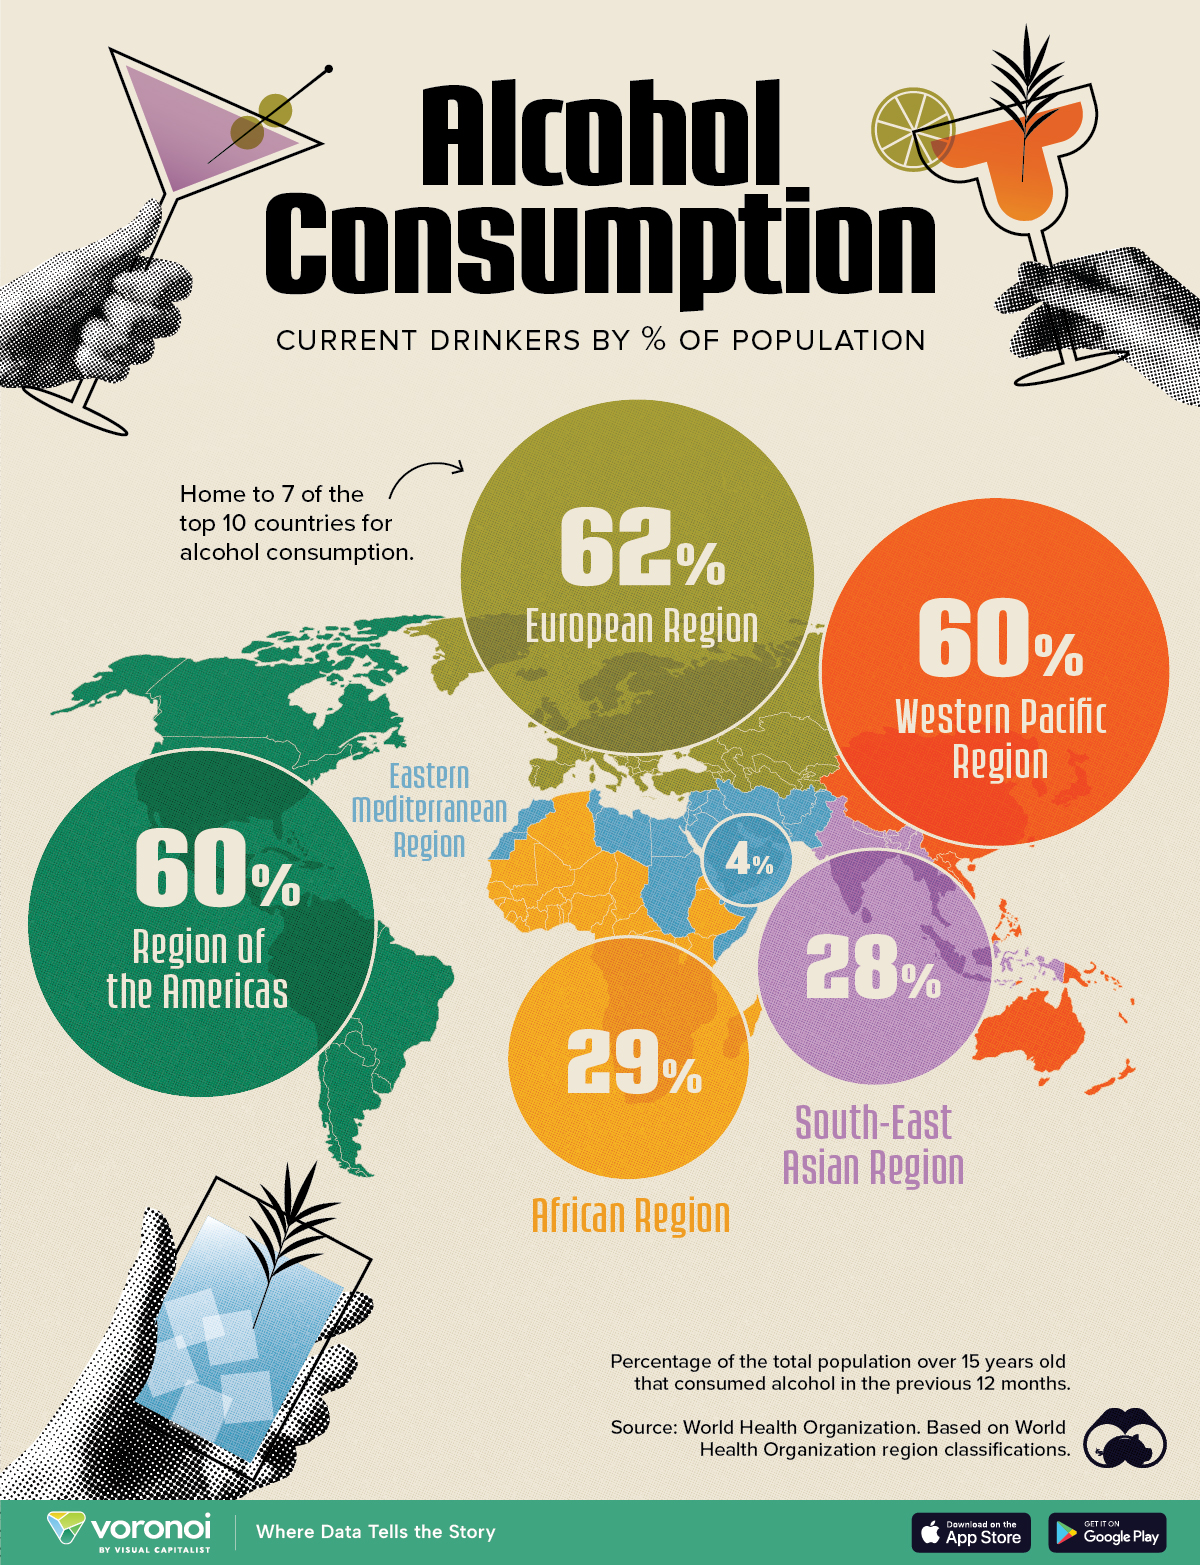
Mapped: Alcohol Consumption by Region
This was originally posted on our Voronoi app. Download the app for free on iOS or Android and discover incredible data-driven charts from a variety of trusted sources.

This article was written by Brandon Smith and originally published at Birch Gold Group
In the past three years China has accelerated export agreements and industrial operations in Africa, becoming the continent’s largest bilateral trade partner. Given Africa’s complete lack of development and GDP, the Asian rush to cement economic ties might seem strange. However, I would argue that China is adapting to events that haven’t quite happened yet.