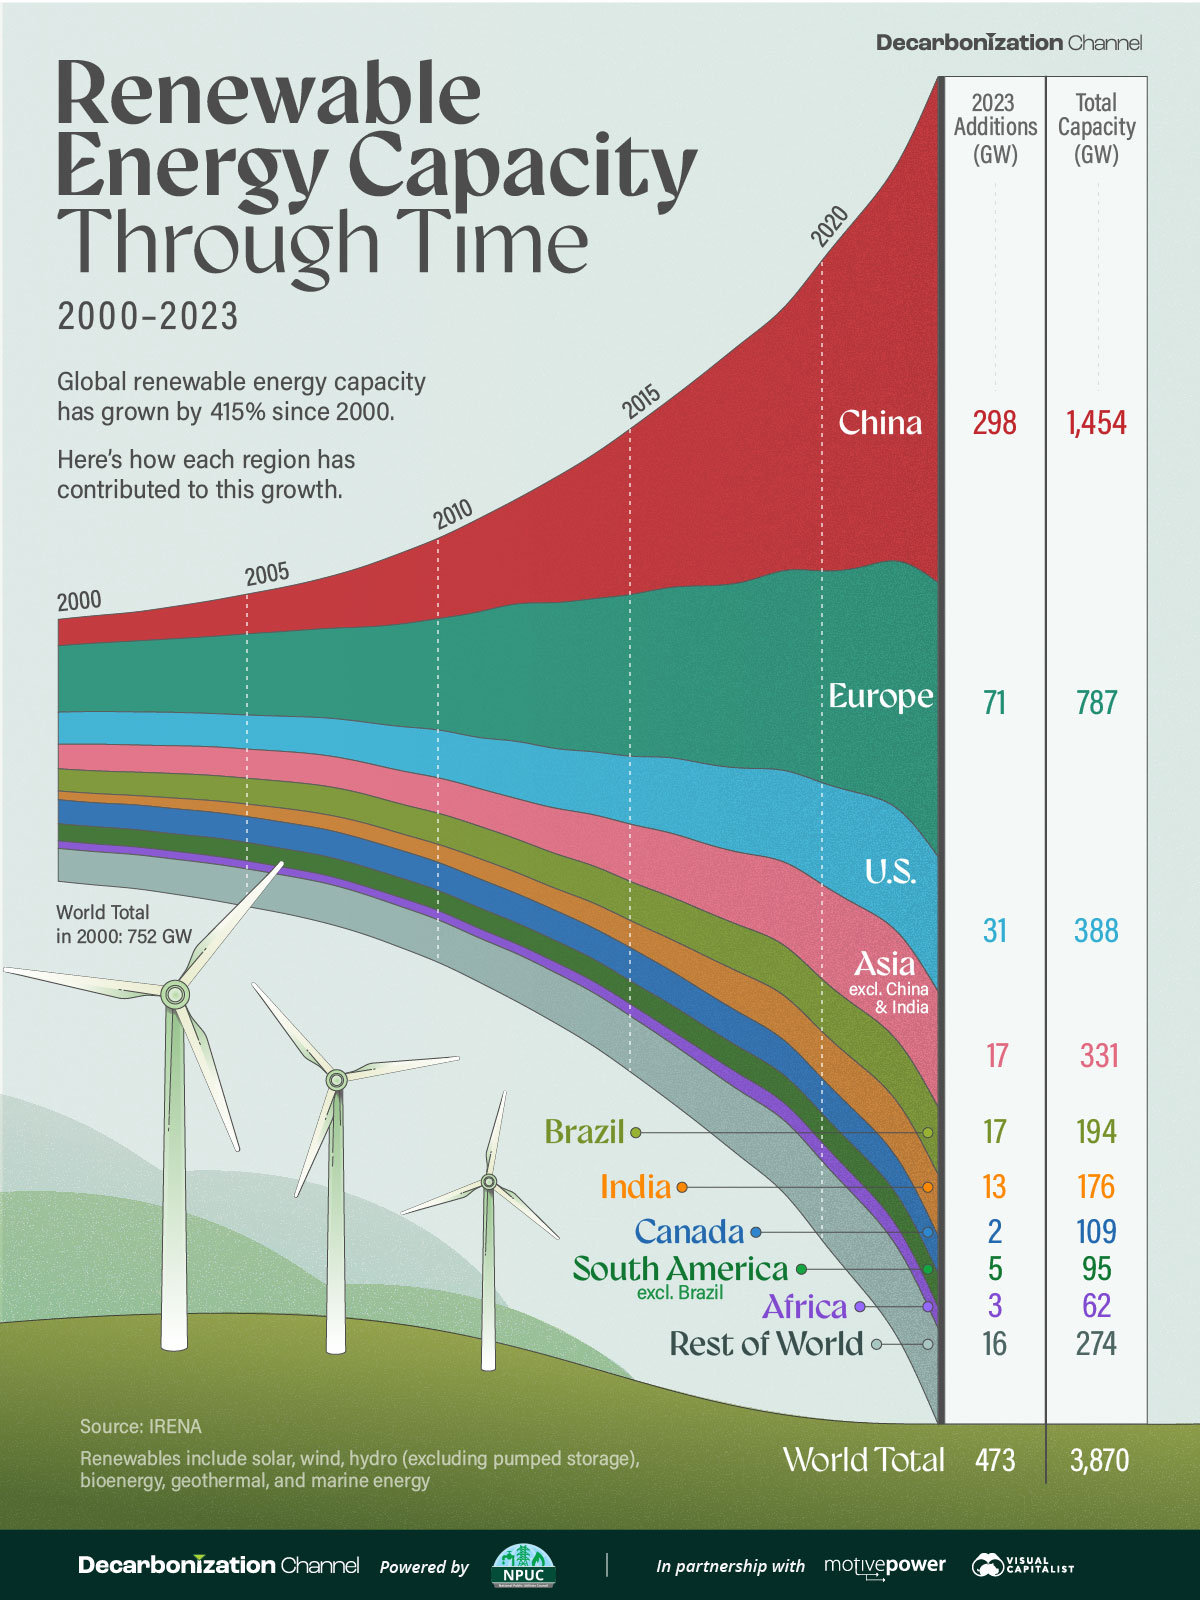
Visualized: Renewable Energy Capacity Through Time (2000–2023)
Published
25 mins ago
on
June 18, 2024
| 37 views
-->
By
Selin Oğuz
Article & Editing
- Ryan Bellefontaine
Graphics & Design

Published
25 mins ago
on
June 18, 2024
| 37 views
-->
By
Selin Oğuz
Article & Editing
Graphics & Design
Published
9 seconds ago
on
May 28, 2024
| 8 views
-->
By
Alan Kennedy
Article & Editing
Graphics & Design
![]()
See this visualization first on the Voronoi app.
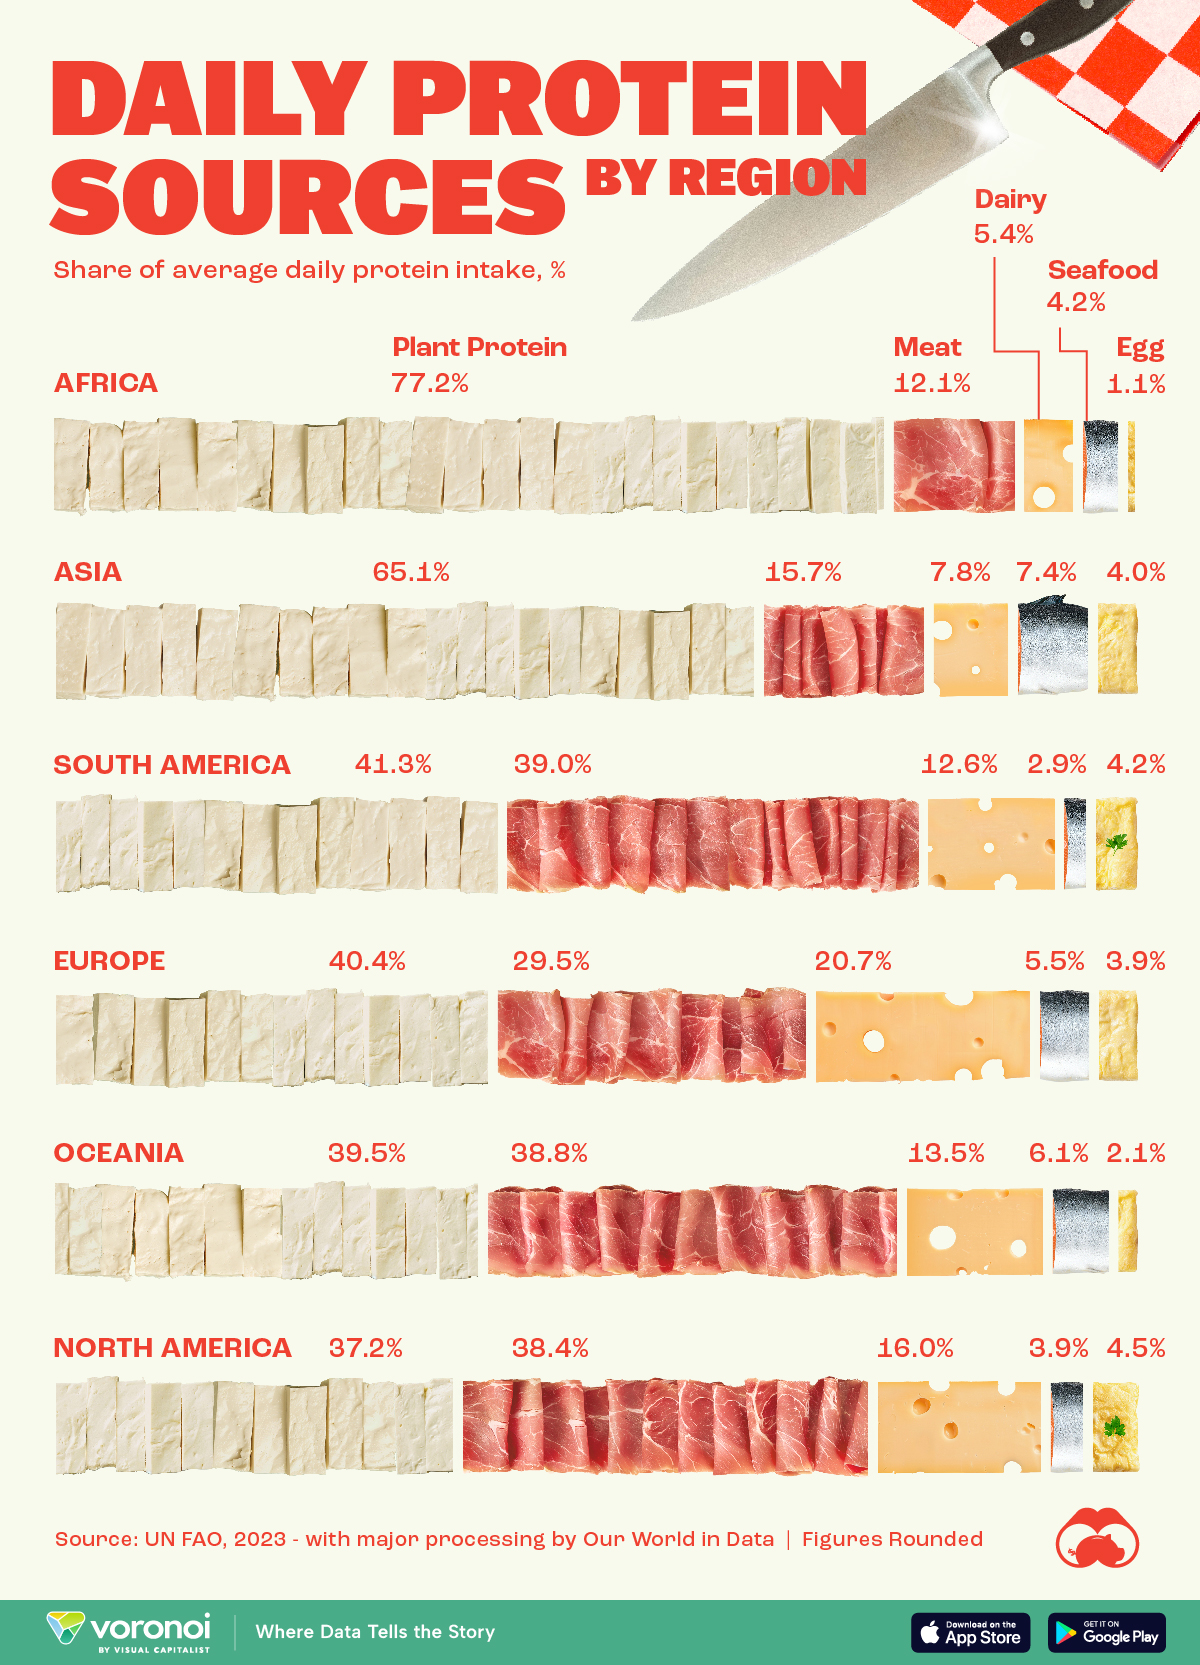
Visualizing Daily Protein Sources by Region
This was originally posted on our Voronoi app. Download the app for free on iOS or Android and discover incredible data-driven charts from a variety of trusted sources.
Published
1 hour ago
on
May 21, 2024
| 22 views
-->
By
Alan Kennedy
Graphics & Design
![]()
See this visualization first on the Voronoi app.
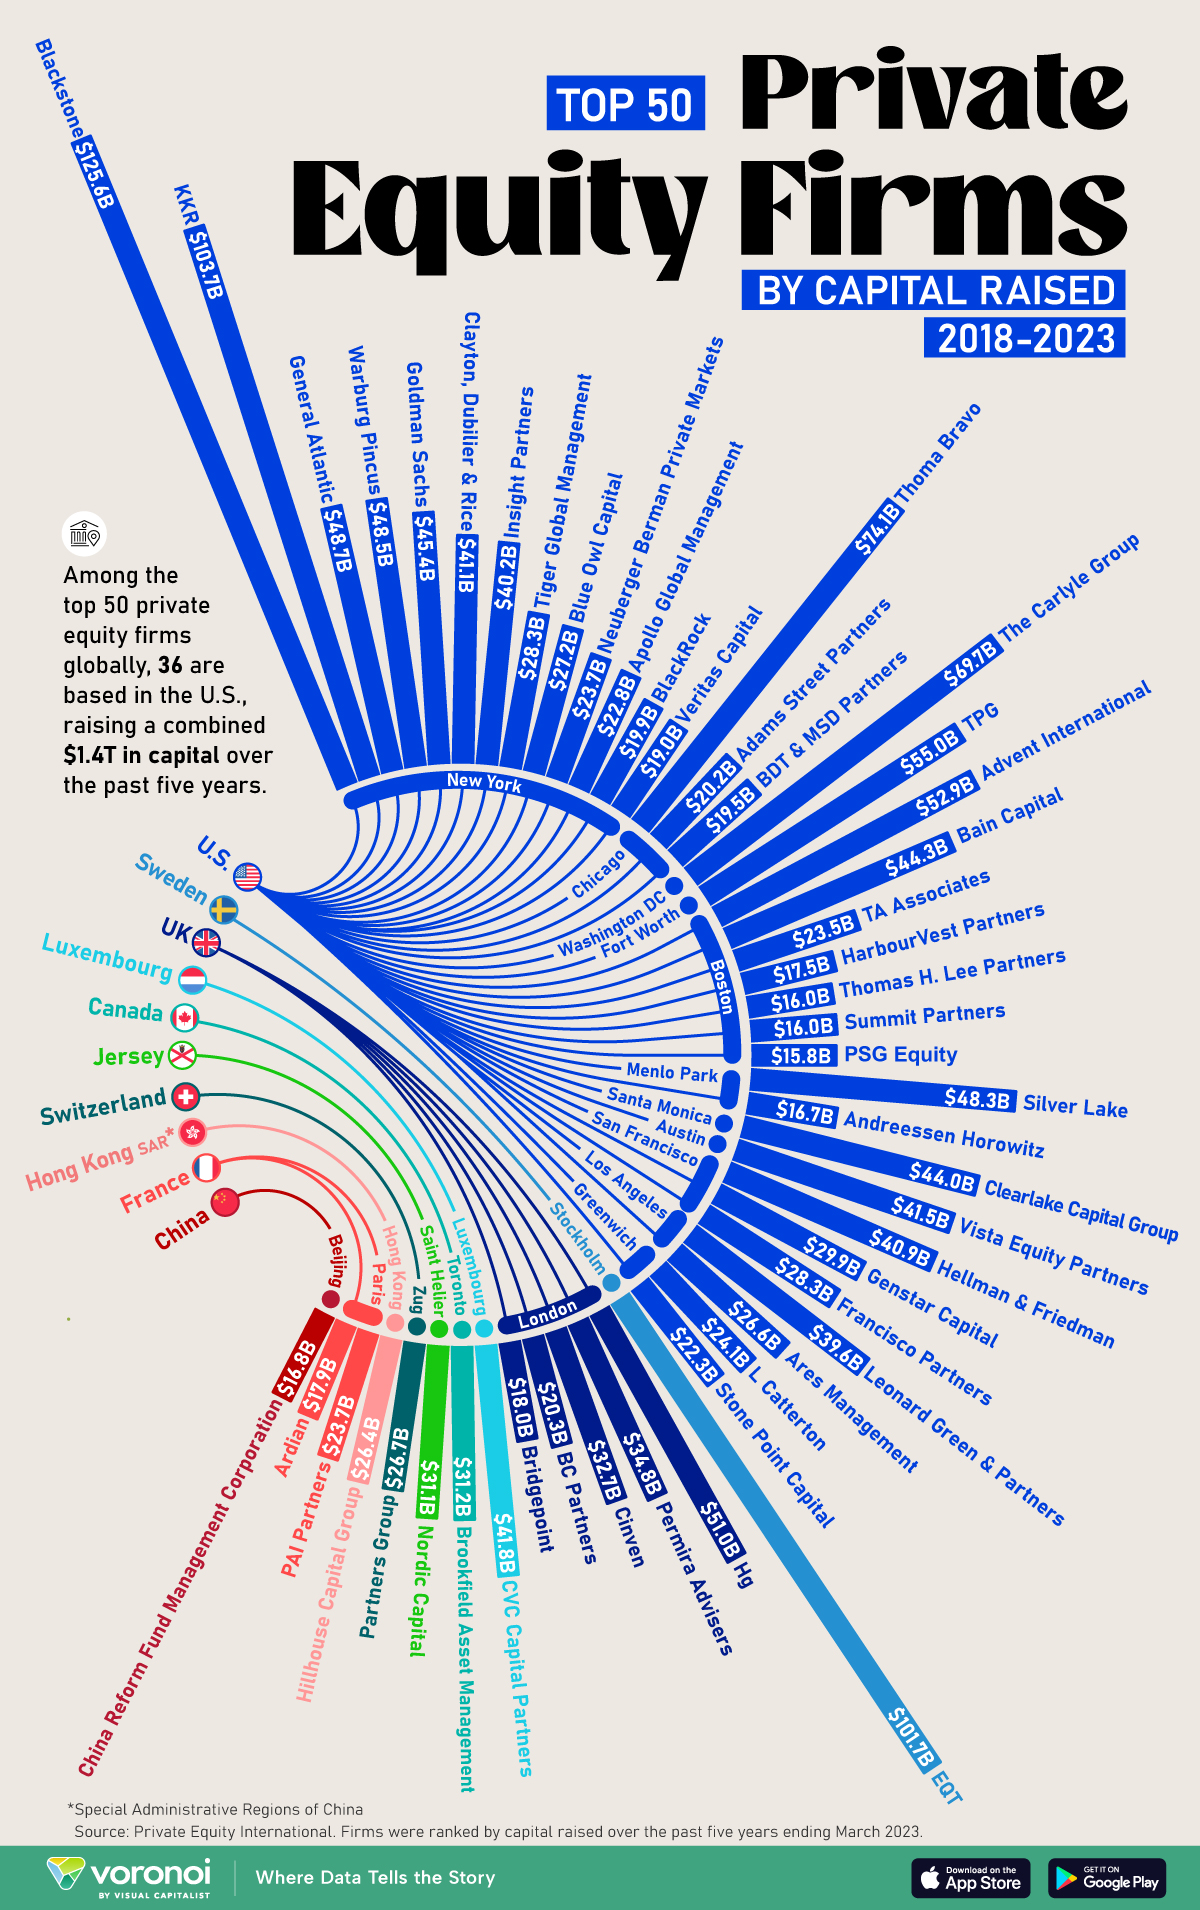
The World’s 50 Largest Private Equity Firms
This was originally posted on our Voronoi app. Download the app for free on iOS or Android and discover incredible data-driven charts from a variety of trusted sources.