Small Cap Stocks Soar On The Lowest Volume Day Of 2016

Another crazy day in the markets...
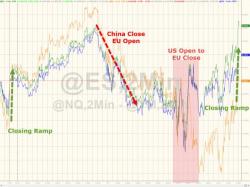
While stocks dropped and popped on the day... with a panic-buying scramble into the close to get Nasdaq unch...
On SPY's lowest volume day of 2016

Another crazy day in the markets...
While stocks dropped and popped on the day... with a panic-buying scramble into the close to get Nasdaq unch...
On SPY's lowest volume day of 2016
Given the vicious downward spiral of competitive devaluation that is washing around the world's economic bathtub, it appears - just as we saw during The Great Depression - that currency wars have given way to mal-investment-fueled protectionism as US launches the first missile in the trade wars with a massive 266% tariff on imports of cold-rolled steel. “There’ll be a short-term benefit,“ said John Packard of Steel Market Update. ”However, in the long run, the U.S.
With GAAP valuations topping 22x, macro data weakening everywhere, and US equities at their most overbought since 2004, what could possibly go wrong?
The McClellan Oscillator has reached over 90 which represents a highly overbought level. However, more amazingly, if you look at it through the lens of a monthly chart there is no evidence of any correction ever having taken place in 2016. No red whatsoever
Source: NorthmanTrader.com

HYG - the high yield bond ETF - is trading at its richest to NAV in over 4 years after 7 straight days of inflows. This flowgasm seemed to crescendo yesterday where Credit Suisse estimated a very sizeable HY retail fund inflows (total amount hitting ~$1.9bn) which they note beat 5-Nov-2014 as being the largest inflow day ever.
With the ETF at such an extreme in valuation and given the historical performance of the fund after 7 straight days of inflows...

Despite Andy Hall's wish hope forecast guess statement that "the bottom is in," for crude (and oil analysts unicorn-like forecast of $47 by year-end), it seems oil options traders disagree significantly.
The cost of protect against downside risk is the highest it has been in a year, despite underlying oil prices being at 8-week highs
(chart shows implied vol spread between Dec 2016 Crude Puts vs Calls +/-1.5 Sigma)