![]()
See this visualization first on the Voronoi app.
Use This Visualization
Mapped: U.S. Poverty Rates by State
This was originally posted on our Voronoi app. Download the app for free on iOS or Android and discover incredible data-driven charts from a variety of trusted sources.
Key Takeaways
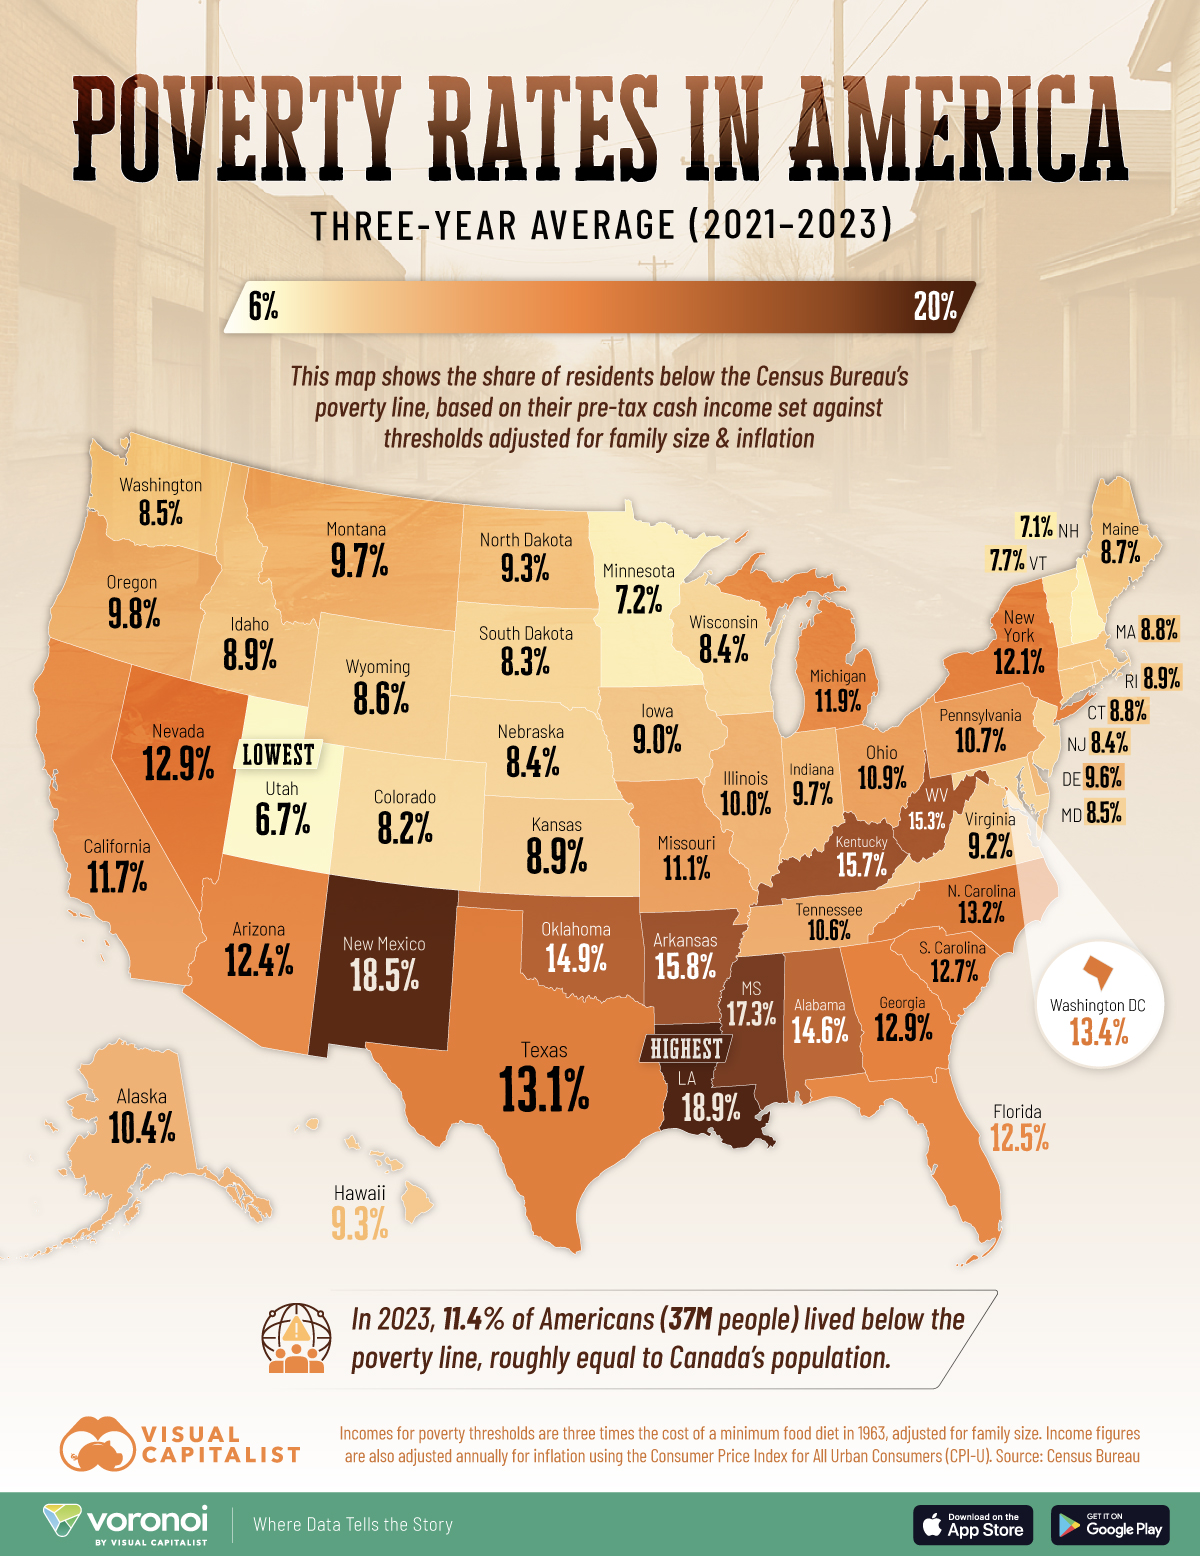
- The highest U.S. poverty rates are concentrated in the South and Southwestern states.
- Louisiana leads at 18.9%, followed by New Mexico (18.5%), Mississippi (17.3%), Arkansas (15.8%), and West Virginia (15.3%).
America’s economic landscape looks very different depending on where you live.
This map of U.S. poverty rates by state makes that disparity clearer.
Each shade represents the share of residents living below the poverty line, inviting quick comparisons across the country.
The data for this visualization comes from the U.S. Census Bureau.
The U.S. Census Bureau calculates poverty lines using pretax household income against a threshold at three times the cost of a minimum food diet from 1963, adjusted for family size and inflation.
For reference, this is a quick guide on how much a household needs to be earning to be considered below the poverty line in 2023.
- One person: ≤$15,480
- Two people: ≤$19,680
- Three people: ≤$24,230
- Four people: ≤$31,200
Ranked: U.S. Poverty Rates by State
Louisiana tops the list at 18.9%, leaving nearly one in five residents below the poverty threshold despite the state’s large energy sector.
| Rank | State | State Code | Share of Population in Poverty |
# in Poverty |
|---|---|---|---|---|
| 1 | Louisiana | LA | 18.9% | 853K |
| 2 | New Mexico | NM | 18.5% | 388K |
| 3 | Mississippi | MS | 17.3% | 501K |
| 4 | Arkansas | AR | 15.8% | 473K |
| 5 | Kentucky | KY | 15.7% | 699K |
| 6 | West Virginia | WV | 15.3% | 268K |
| 7 | Oklahoma | OK | 14.9% | 589K |
| 8 | Alabama | AL | 14.6% | 727K |
| 9 | District of Columbia | DC | 13.4% | 88K |
| 10 | North Carolina | NC | 13.2% | 1.4M |
| 11 | Texas | TX | 13.1% | 3.9M |
| 12 | Georgia | GA | 12.9% | 1.4M |
| 13 | Nevada | NV | 12.9% | 409K |
| 14 | South Carolina | SC | 12.7% | 673K |
| 15 | Florida | FL | 12.5% | 2.8M |
| 16 | Arizona | AZ | 12.4% | 903K |
| 17 | New York | NY | 12.1% | 2.3M |
| 18 | Michigan | MI | 11.9% | 1.2M |
| 19 | California | CA | 11.7% | 4.5M |
| 20 | Missouri | MO | 11.1% | 675K |
| 21 | Ohio | OH | 10.9% | 1.3M |
| 22 | Pennsylvania | PA | 10.7% | 1.4M |
| 23 | Tennessee | TN | 10.6% | 744K |
| 24 | Alaska | AK | 10.4% | 74K |
| 25 | Illinois | IL | 10% | 1.2M |
| 26 | Oregon | OR | 9.8% | 415K |
| 27 | Indiana | IN | 9.7% | 659K |
| 28 | Montana | MT | 9.7% | 109K |
| 29 | Delaware | DE | 9.6% | 98K |
| 30 | Hawaii | HI | 9.3% | 133K |
| 31 | North Dakota | ND | 9.3% | 72K |
| 32 | Virginia | VA | 9.2% | 783K |
| 33 | Iowa | IA | 9% | 287K |
| 34 | Idaho | ID | 8.9% | 172K |
| 35 | Kansas | KS | 8.9% | 255K |
| 36 | Rhode Island | RI | 8.9% | 96K |
| 37 | Connecticut | CT | 8.8% | 318K |
| 38 | Massachusetts | MA | 8.8% | 604K |
| 39 | Maine | ME | 8.7% | 120K |
| 40 | Wyoming | WY | 8.6% | 49K |
| 41 | Maryland | MD | 8.5% | 524K |
| 42 | Washington | WA | 8.5% | 658K |
| 43 | Nebraska | NE | 8.4% | 165K |
| 44 | New Jersey | NJ | 8.4% | 776K |
| 45 | Wisconsin | WI | 8.4% | 490K |
| 46 | South Dakota | SD | 8.3% | 74K |
| 47 | Colorado | CO | 8.2% | 473K |
| 48 | Vermont | VT | 7.7% | 49K |
| 49 | Minnesota | MN | 7.2% | 409K |
| 50 | New Hampshire | NH | 7.1% | 98K |
| 51 | Utah | UT | 6.7% | 226K |
| N/A | U.S. | US | 11.4% | 37.6M |
Neighboring Mississippi (17.3%) and Arkansas (15.8%) tell a similar story of limited job diversity and chronically low household incomes.
In fact, a contiguous belt stretching from Louisiana and Mississippi through Arkansas and up to West Virginia contains every state with poverty rates above 15%.
Historic underinvestment, weaker safety-net programs, and lower average wages all help explain why the South accounts for four of the five worst-affected states.
Northern and Plains States See the Lowest Poverty Shares
In stark contrast, Utah (6.7%), New Hampshire (7.1%), Minnesota (7.2%), and Colorado (8.2%) post some of the lowest poverty figures in the country.
These states benefit from stronger labor markets, higher median wages, and broader access to education and healthcare.
Even populous Midwestern states like Illinois and Wisconsin keep poverty near or below 10%, underscoring how economic structure and public policy can insulate households from hardship.
Geography, then, is a reliable—if imperfect—proxy for opportunity in today’s America.
Population Size Skews the National Picture
Looking only at rates can mask the human scale of poverty.
California’s poverty rate sits near the national average at 11.7%, yet its sheer population means 4.5 million Californians live in poverty.
Texas tells a similar story: its 13.1% rate translates into 3.9 million people, the second-largest total nationwide.
Altogether, the U.S. counted 37.6 million residents in poverty during in 2023, almost the size of Canada’s entire population.
Learn More on the Voronoi App ![]()
If you enjoyed today’s post, check out Mapped: Average Salary by State in 2025 on Voronoi, the new app from Visual Capitalist.