You are here

Business

How The Current Sell-Off Stacks Up To All Previous Bear Markets

Based on 43 large sell-offs in the world's major equity markets, Morgan Stanley gauges how the current market slide compares to bear markets and bull corrections through history. While they have tended to last about 190 business days, with drawdowns around 30%, the current environment is considerably weaker than the typical bear market beginning...

The Bear Necessities – What’s the ‘Typical’ Sell-Off Environment?

The Four Scariest Charts For Energy Investors

The Four Scariest Charts For Energy Investors

Much has been said, and many charts shown demonstrating how collapsing oil prices equate with a recessionary (and, according to at least one Dallas Fed respondent, "depressionary") hit for the US energy space and manufacturing sector first, and subsequently, contagion for US banks various other investors in the US shale space, and ultimately the broader economy.

Perhaps too much.

So in an attempt to simply some of the confusion, here are just four charts which, in our opinion, are among the scariest for energy investors.

"Pipe Dreams" Of A Gently Rising Oil Price

"Pipe Dreams" Of A Gently Rising Oil Price

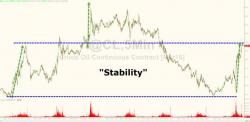
What does the world really want from oil prices? There are conflicting views, but, as Bloomberg's Mark Cudmore notes, ultimately a stable and slowly appreciating oil price is probably best.

It’s quite clear from price action that financial markets are keen to see oil bounce. Crude (with the yuan) led the early-year rout before spear-heading the broad relief rally last week. And its capitulation yesterday has snuffed out animal spirits globally.

Pages