Ranked: Top 10 Single-Day Market Cap Gains
![]()
See this visualization first on the Voronoi app.
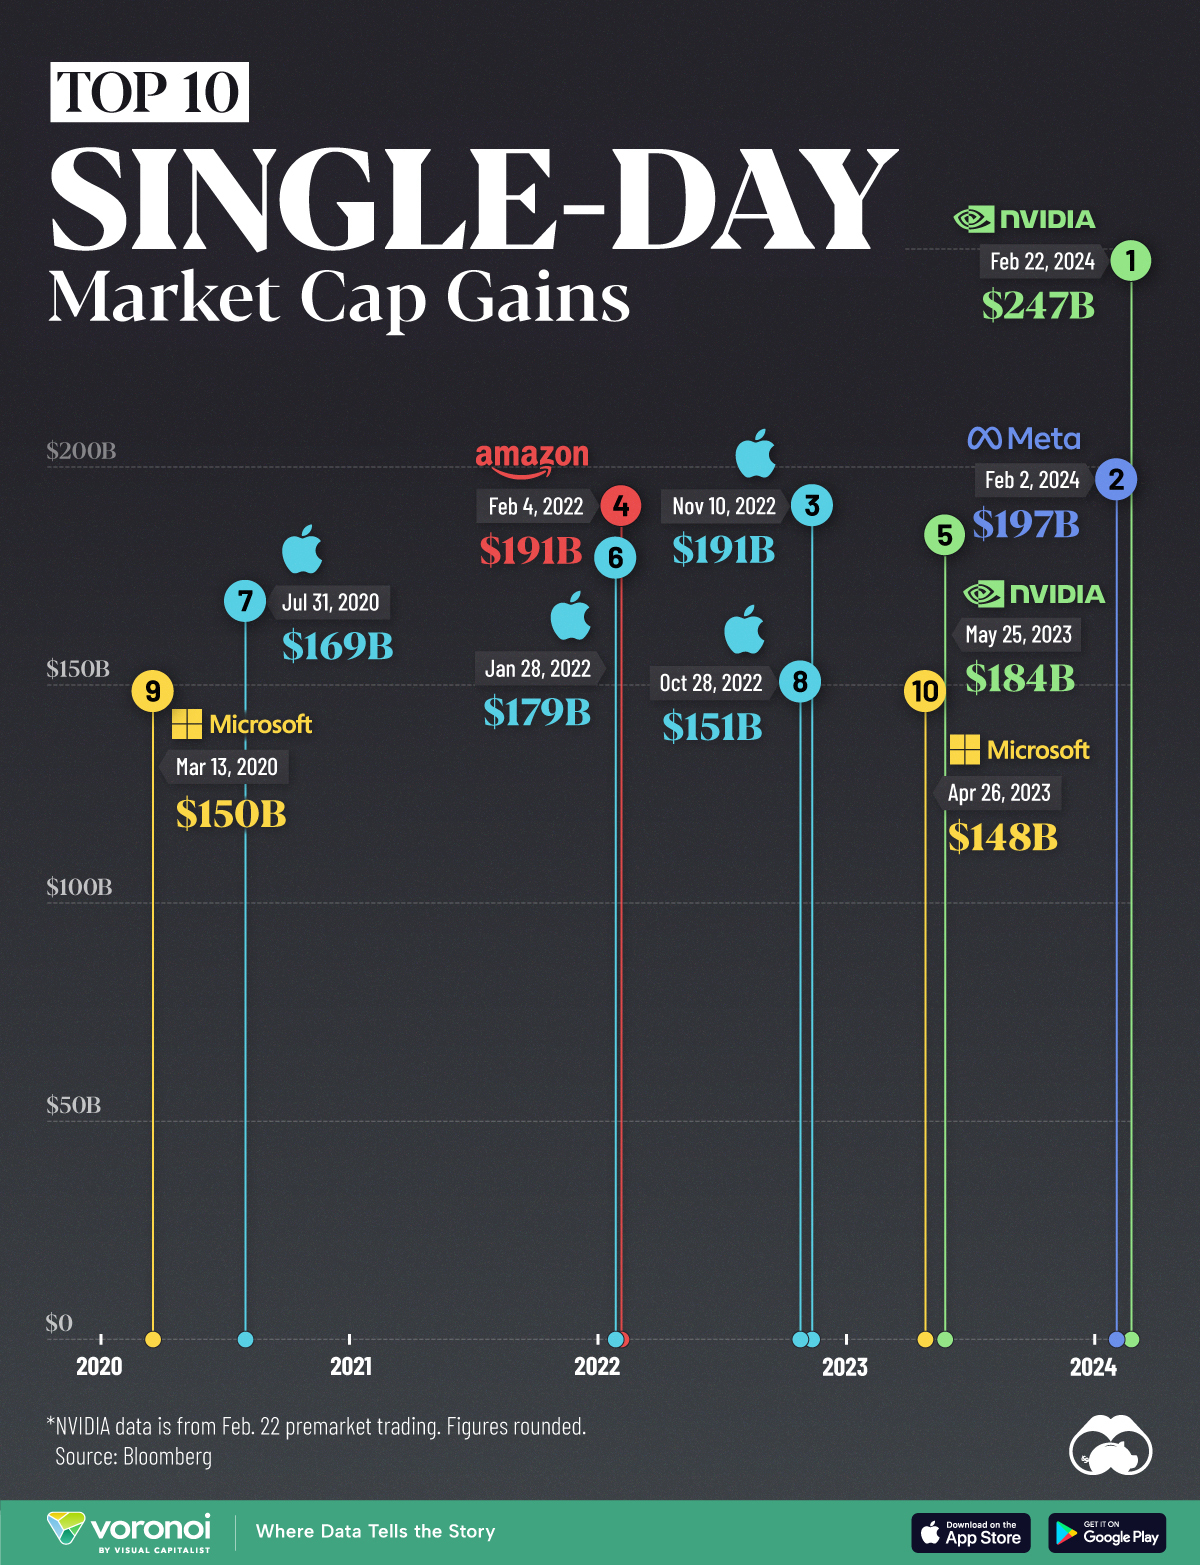
The 10 Biggest Single-Day Market Cap Gains
This was originally posted on our Voronoi app. Download the app for free on iOS or Android and discover incredible data-driven charts from a variety of trusted sources.