Charted: The Rising Share of U.S. Data Center Power Demand
![]()
Published
19 minutes ago
on
September 12, 2025
| 6 views
-->
By
Julia Wendling
Article & Editing
- Alan Kennedy
Graphics & Design
![]()
Published
19 minutes ago
on
September 12, 2025
| 6 views
-->
By
Julia Wendling
Article & Editing
Graphics & Design
![]()
Published
25 minutes ago
on
September 12, 2025
| 11 views
-->
By
Julia Wendling
Article & Editing
Graphics & Design
Published
36 minutes ago
on
September 12, 2025
| 11 views
-->
By
Julia Wendling
Article & Editing
Graphics & Design
![]()
See this visualization first on the Voronoi app.
Use This Visualization
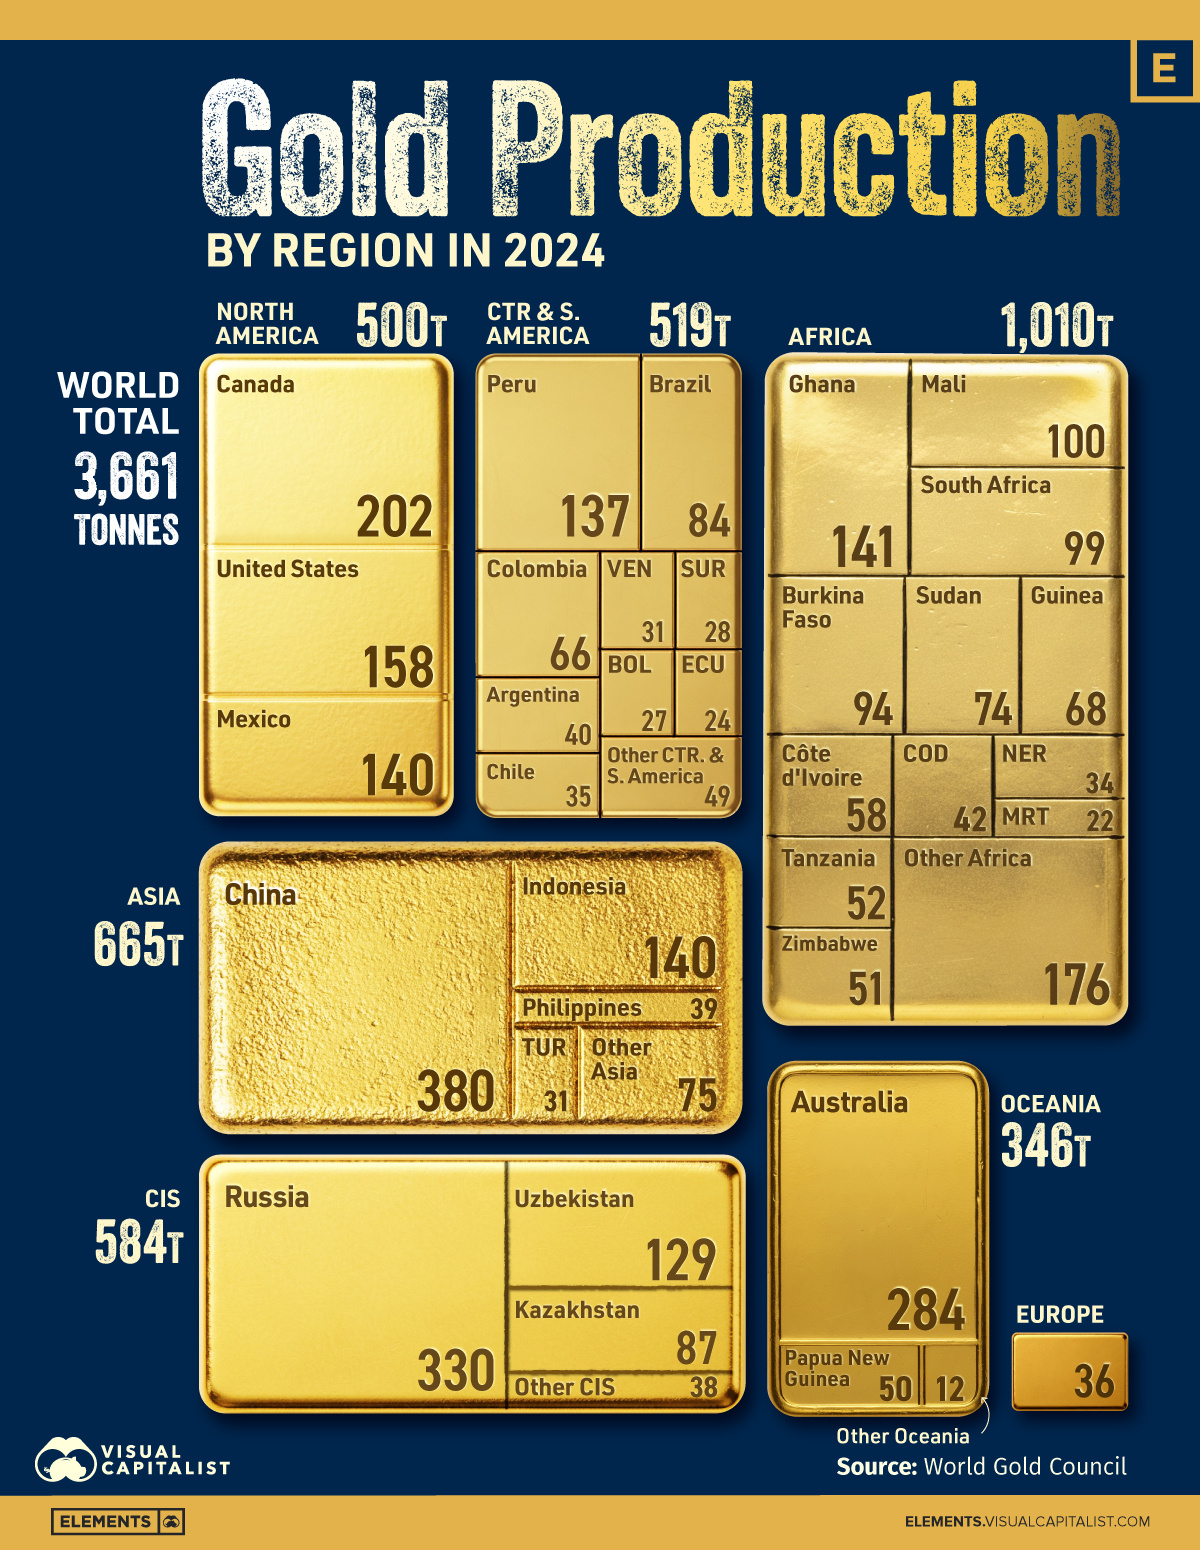
Visualizing Gold Production by Region
This was originally posted on our Voronoi app. Download the app for free on iOS or Android and discover incredible data-driven charts from a variety of trusted sources.
Key Takeaways
![]()
See this visualization first on the Voronoi app.
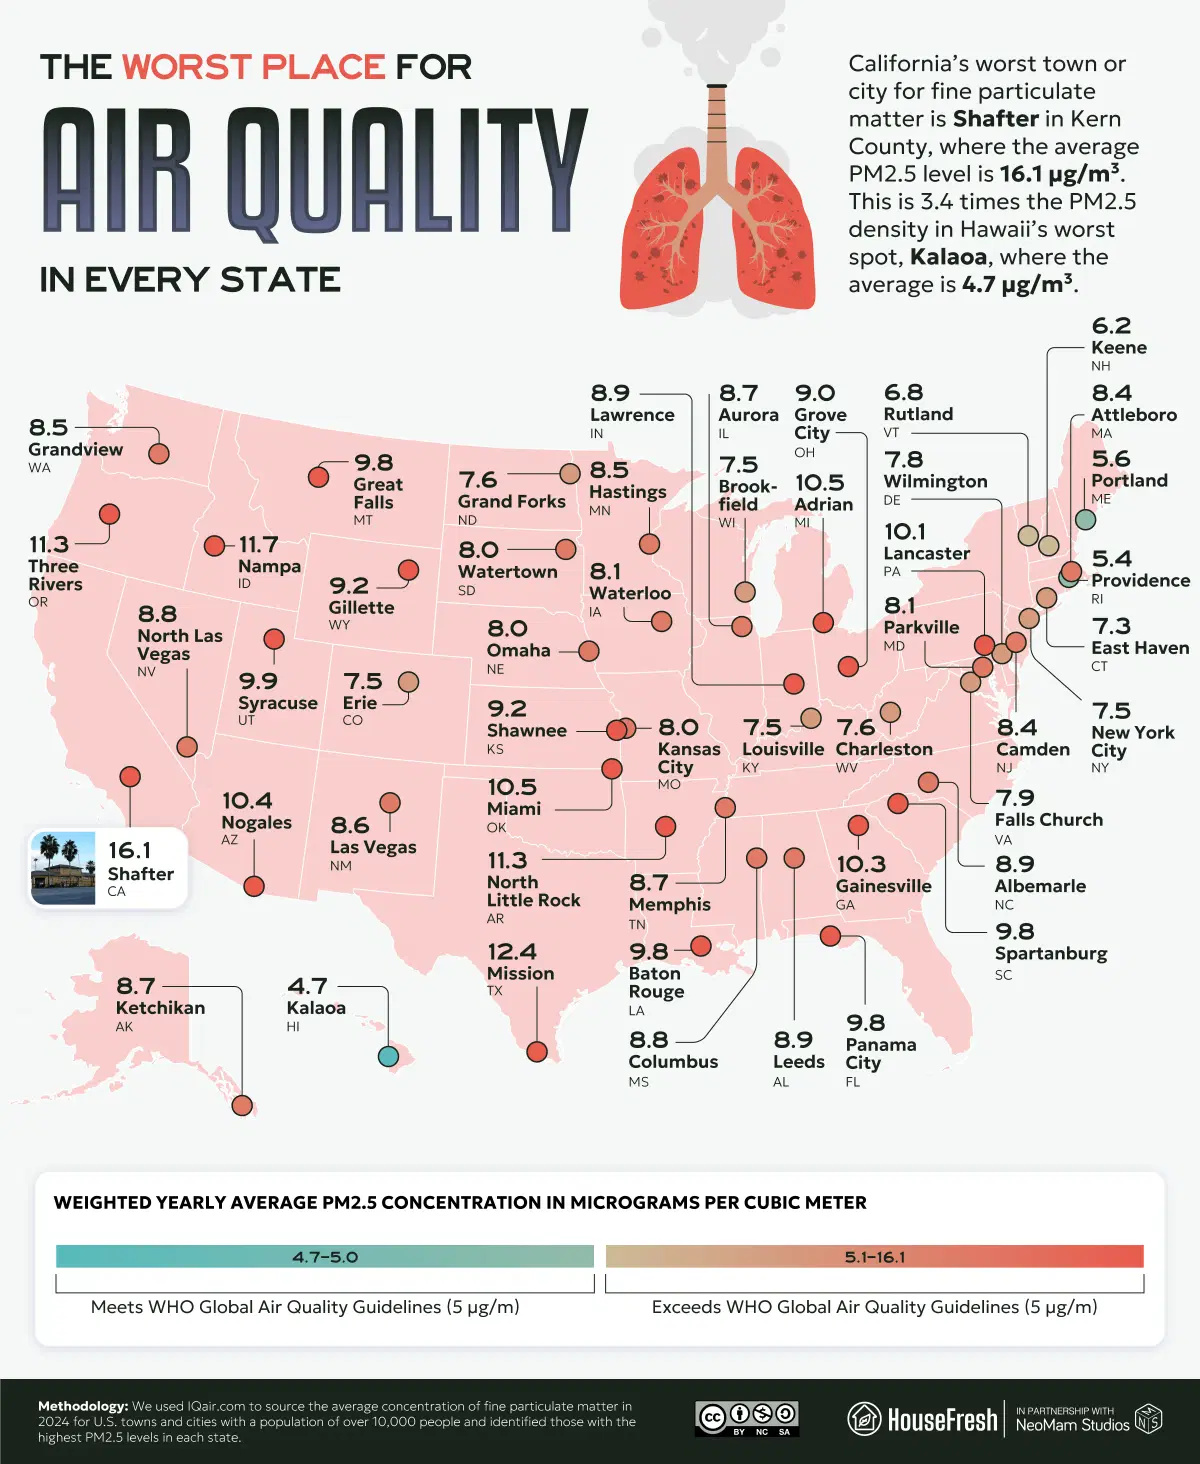
Mapped: Where the Air Quality is Worst in Each U.S. State
This was originally posted on our Voronoi app. Download the app for free on iOS or Android and discover incredible data-driven charts from a variety of trusted sources.