![]()
See this visualization first on the Voronoi app.
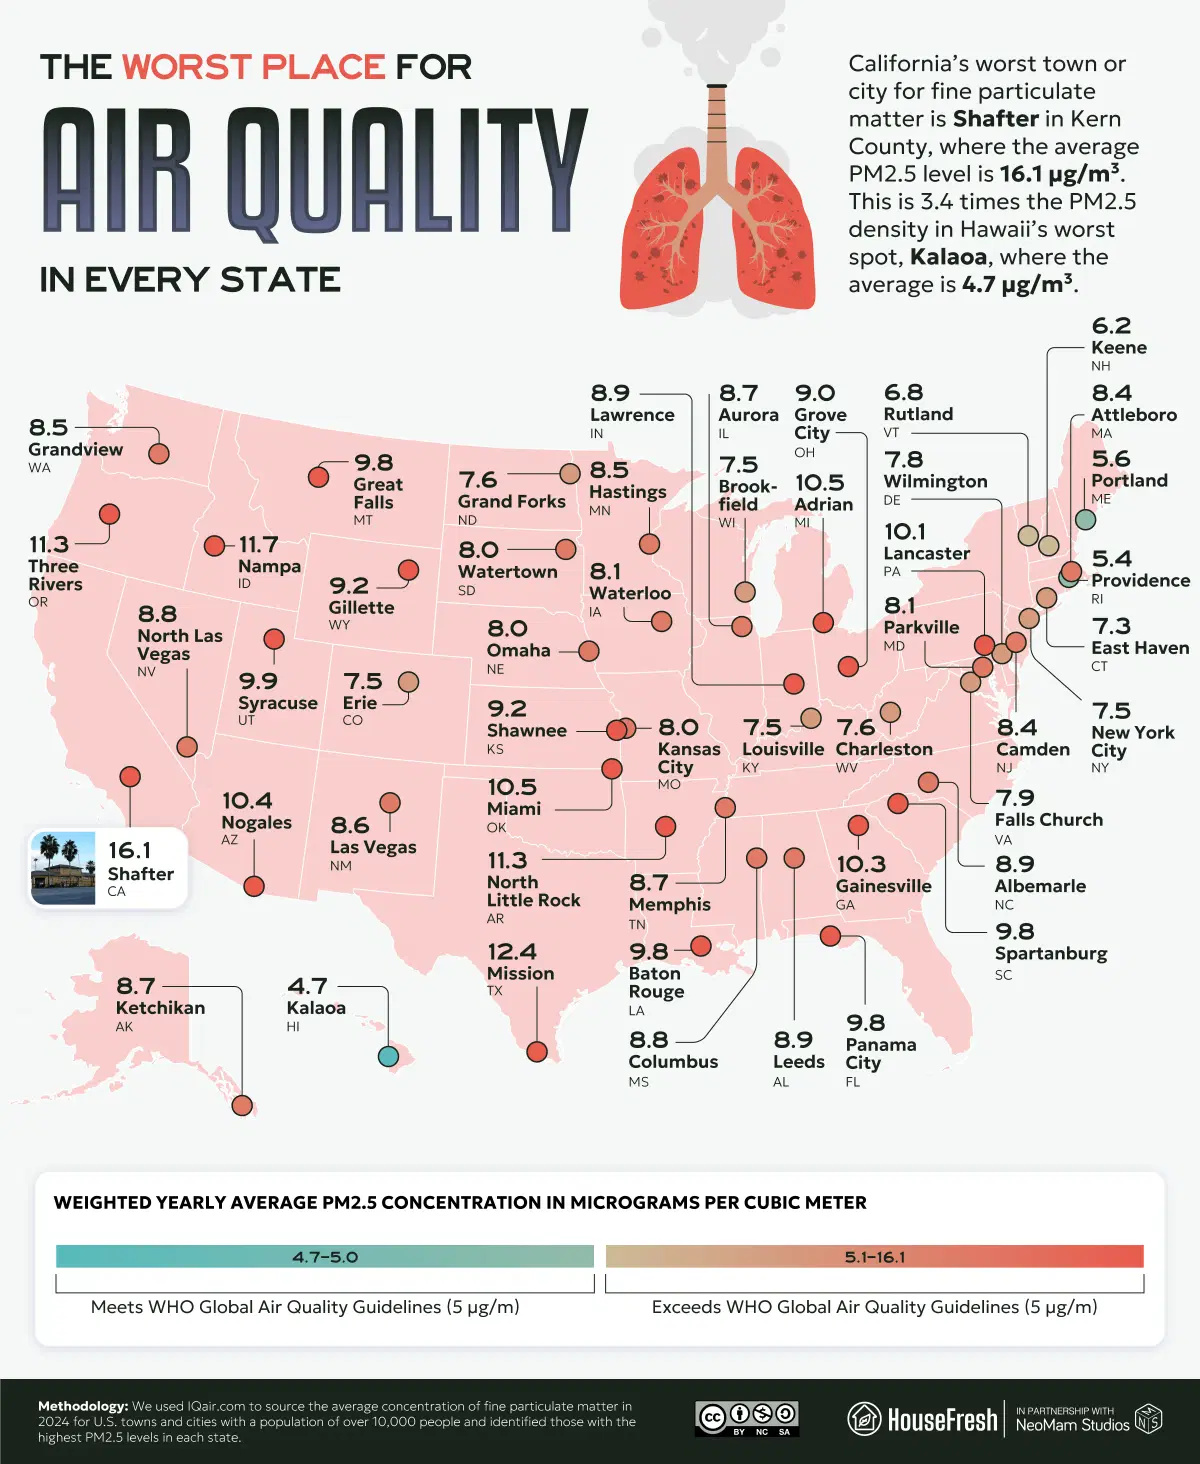
Mapped: Where the Air Quality is Worst in Each U.S. State
This was originally posted on our Voronoi app. Download the app for free on iOS or Android and discover incredible data-driven charts from a variety of trusted sources.
- Shafter, California has the worst air quality in the U.S., with PM2.5 levels averaging 16.1 µg/m³.
- Mission, Texas and Nampa, Idaho also rank among the most polluted cities by PM2.5 concentration.
- Kalaoa, Hawaii has the best “worst” air quality at just 4.7 µg/m³, below WHO guidelines.
Fine particulate matter, or PM2.5, is one of the most harmful forms of air pollution. Defined as particles less than 2.5 micrometers wide, they are small enough to penetrate deep into lungs and even enter the bloodstream. Exposure can lead to asthma, bronchitis, and long-term cardiovascular and respiratory issues.
According to HouseFresh, which analyzed data from IQAir, many U.S. towns continue to face levels far above World Health Organization (WHO) guidelines.
Here are the cities with the worst recorded air quality in each U.S. state in 2024:
| City | State | Yearly Average PM2.5 Concentration (2024) | Equivalent Cigarettes Smoked in 2024 |
|---|---|---|---|
| Shafter | California | 16.1 | 267 |
| Mission | Texas | 12.4 | 206 |
| Nampa | Idaho | 11.7 | 194 |
| North Little Rock | Arkansas | 11.3 | 187 |
| Three Rivers | Oregon | 11.3 | 187 |
| Adrian | Michigan | 10.5 | 174 |
| Miami | Oklahoma | 10.5 | 174 |
| Nogales | Arizona | 10.4 | 173 |
| Gainesville | Georgia | 10.3 | 171 |
| Lancaster | Pennsylvania | 10.1 | 168 |
| Syracuse | Utah | 9.9 | 164 |
| Panama City | Florida | 9.8 | 163 |
| Baton Rouge | Louisiana | 9.8 | 163 |
| Great Falls | Montana | 9.8 | 163 |
| Spartanburg | South Carolina | 9.8 | 163 |
| Shawnee | Kansas | 9.2 | 153 |
| Gillette | Wyoming | 9.2 | 153 |
| Grove City | Ohio | 9.0 | 149 |
| Leeds | Alabama | 8.9 | 148 |
| Lawrence | Indiana | 8.9 | 148 |
| Albemarle | North Carolina | 8.9 | 148 |
| Columbus | Mississippi | 8.8 | 146 |
| North Las Vegas | Nevada | 8.8 | 146 |
| Ketchikan | Alaska | 8.7 | 144 |
| Aurora | Illinois | 8.7 | 144 |
| Memphis | Tennessee | 8.7 | 144 |
| Las Vegas | New Mexico | 8.6 | 143 |
| Hastings | Minnesota | 8.5 | 141 |
| Grandview | Washington | 8.5 | 141 |
| Attleboro | Massachusetts | 8.4 | 139 |
| Camden | New Jersey | 8.4 | 139 |
| Waterloo | Iowa | 8.1 | 134 |
| Parkville | Maryland | 8.1 | 134 |
| Kansas City | Missouri | 8.0 | 133 |
| Omaha | Nebraska | 8.0 | 133 |
| Watertown | South Dakota | 8.0 | 133 |
| Falls Church | Virginia | 7.9 | 131 |
| Wilmington | Delaware | 7.8 | 129 |
| Grand Forks | North Dakota | 7.6 | 126 |
| Charleston | West Virginia | 7.6 | 126 |
| Erie | Colorado | 7.5 | 124 |
| Louisville | Kentucky | 7.5 | 124 |
| New York City | New York | 7.5 | 124 |
| Brookfield | Wisconsin | 7.5 | 124 |
| East Haven | Connecticut | 7.3 | 121 |
| Rutland | Vermont | 6.8 | 113 |
| Keene | New Hampshire | 6.2 | 103 |
| Portland | Maine | 5.6 | 93 |
| Providence | Rhode Island | 5.4 | 90 |
| Kalaoa | Hawaii | 4.7 | 78 |
At a glance, the range is stark: from Shafter, California at 16.1 µg/m³, equivalent to smoking 267 cigarettes a year, to Kalaoa, Hawaii, which comes in under the WHO safety threshold.
California and Texas Lead the Pollution Rankings
Shafter, California stands out as the nation’s worst location for fine particulate matter, with levels over three times higher than Hawaii’s worst city. Much of this pollution comes from agricultural activity, particularly almond farming, which kicks up significant dust during harvest season. Subsidy programs for cleaner farm equipment are in place, but the challenge remains ongoing.
Mission, Texas follows with a yearly PM2.5 average of 12.4 µg/m³, while cities like Nampa, Idaho and North Little Rock, Arkansas also report double-digit pollution levels.
The Geography of Poor Air Quality
Western states like California, Oregon, and Idaho dominate the higher end of the spectrum, but polluted hotspots also appear in the Midwest and South. Lancaster, Pennsylvania (10.1 µg/m³) highlights the issue in the Northeast, while Spartanburg, South Carolina (9.8 µg/m³) represents the Southeast’s worst case.
By contrast, states like Maine (5.6 µg/m³) and Rhode Island (5.4 µg/m³) show much lower pollution levels. Hawaii’s Kalaoa, at 4.7 µg/m³, remains the only city that meets WHO’s stricter guideline of 5 µg/m³.
The Hidden Cost of Breathing
The health impact is easier to visualize when expressed in cigarette equivalents. In Shafter, living with 16.1 µg/m³ of PM2.5 is like smoking 267 cigarettes in a year. Even moderately polluted cities like Syracuse, Utah (9.9 µg/m³) equate to more than 160 cigarettes annually.
These numbers underscore why air quality remains a pressing public health concern—and why local and state-level policies will play a critical role in addressing it.
Learn More on the Voronoi App
See the flip side in the map of the best place for air quality in each U.S. state.