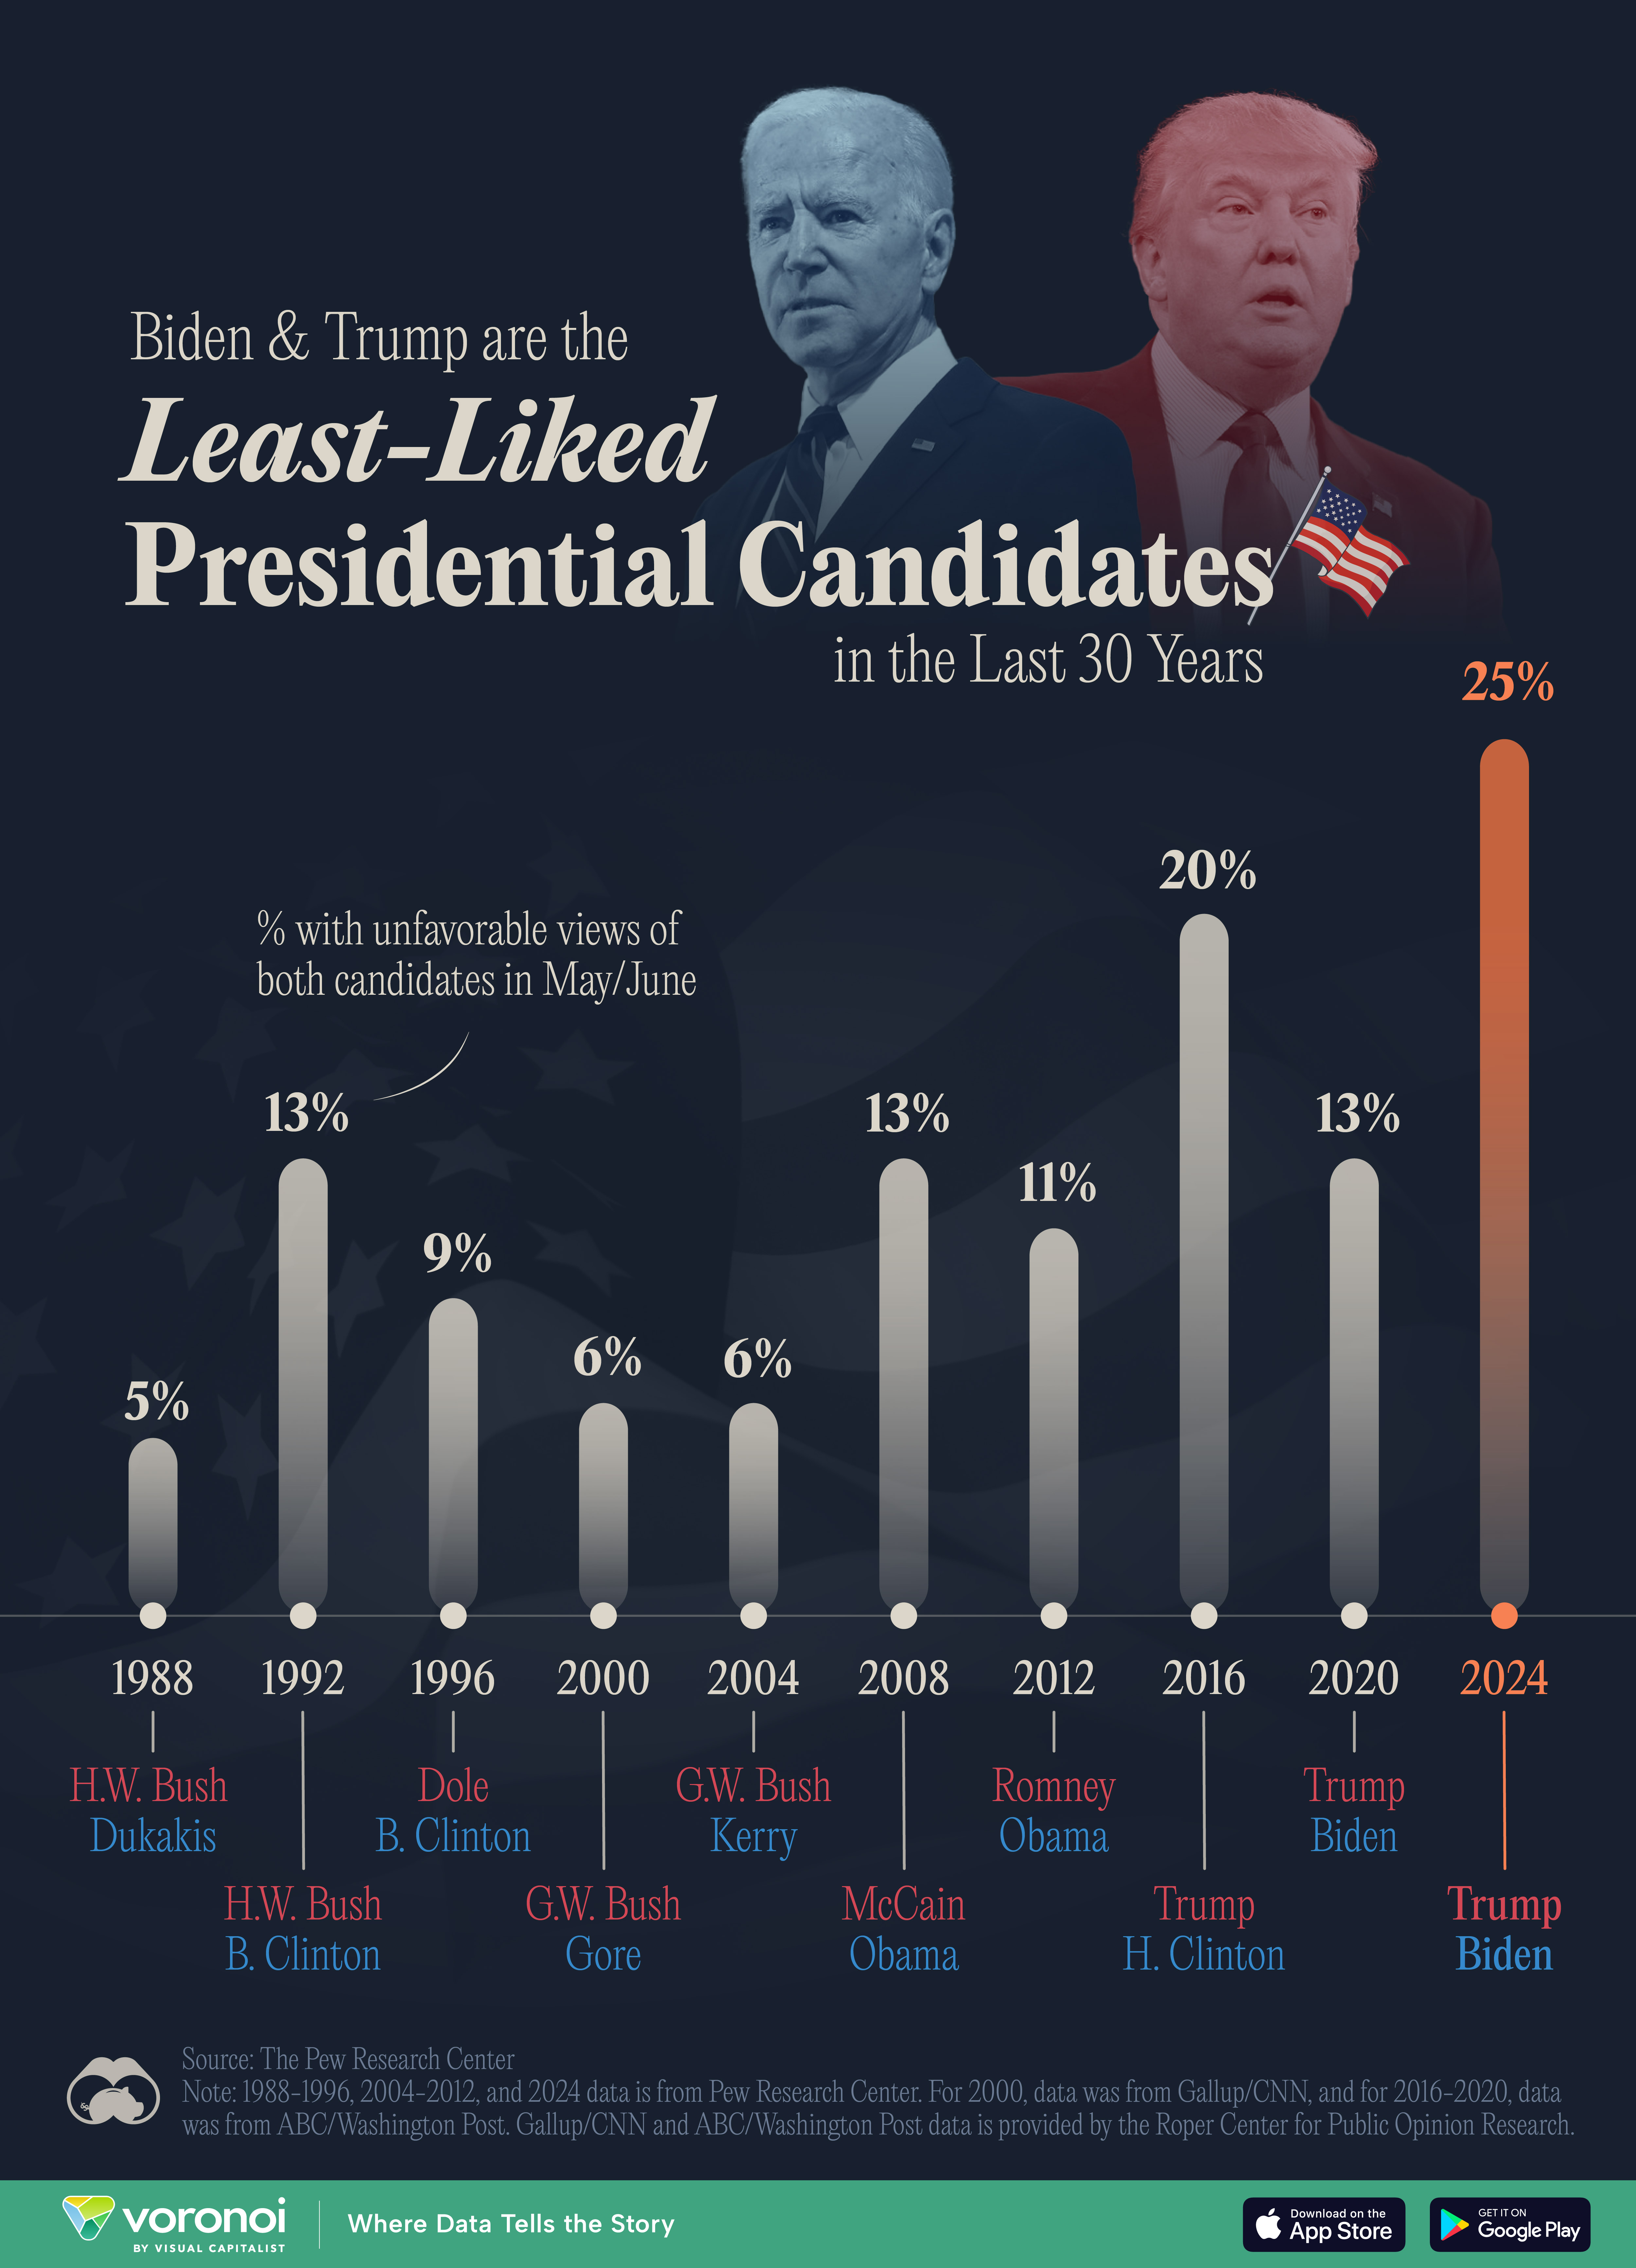
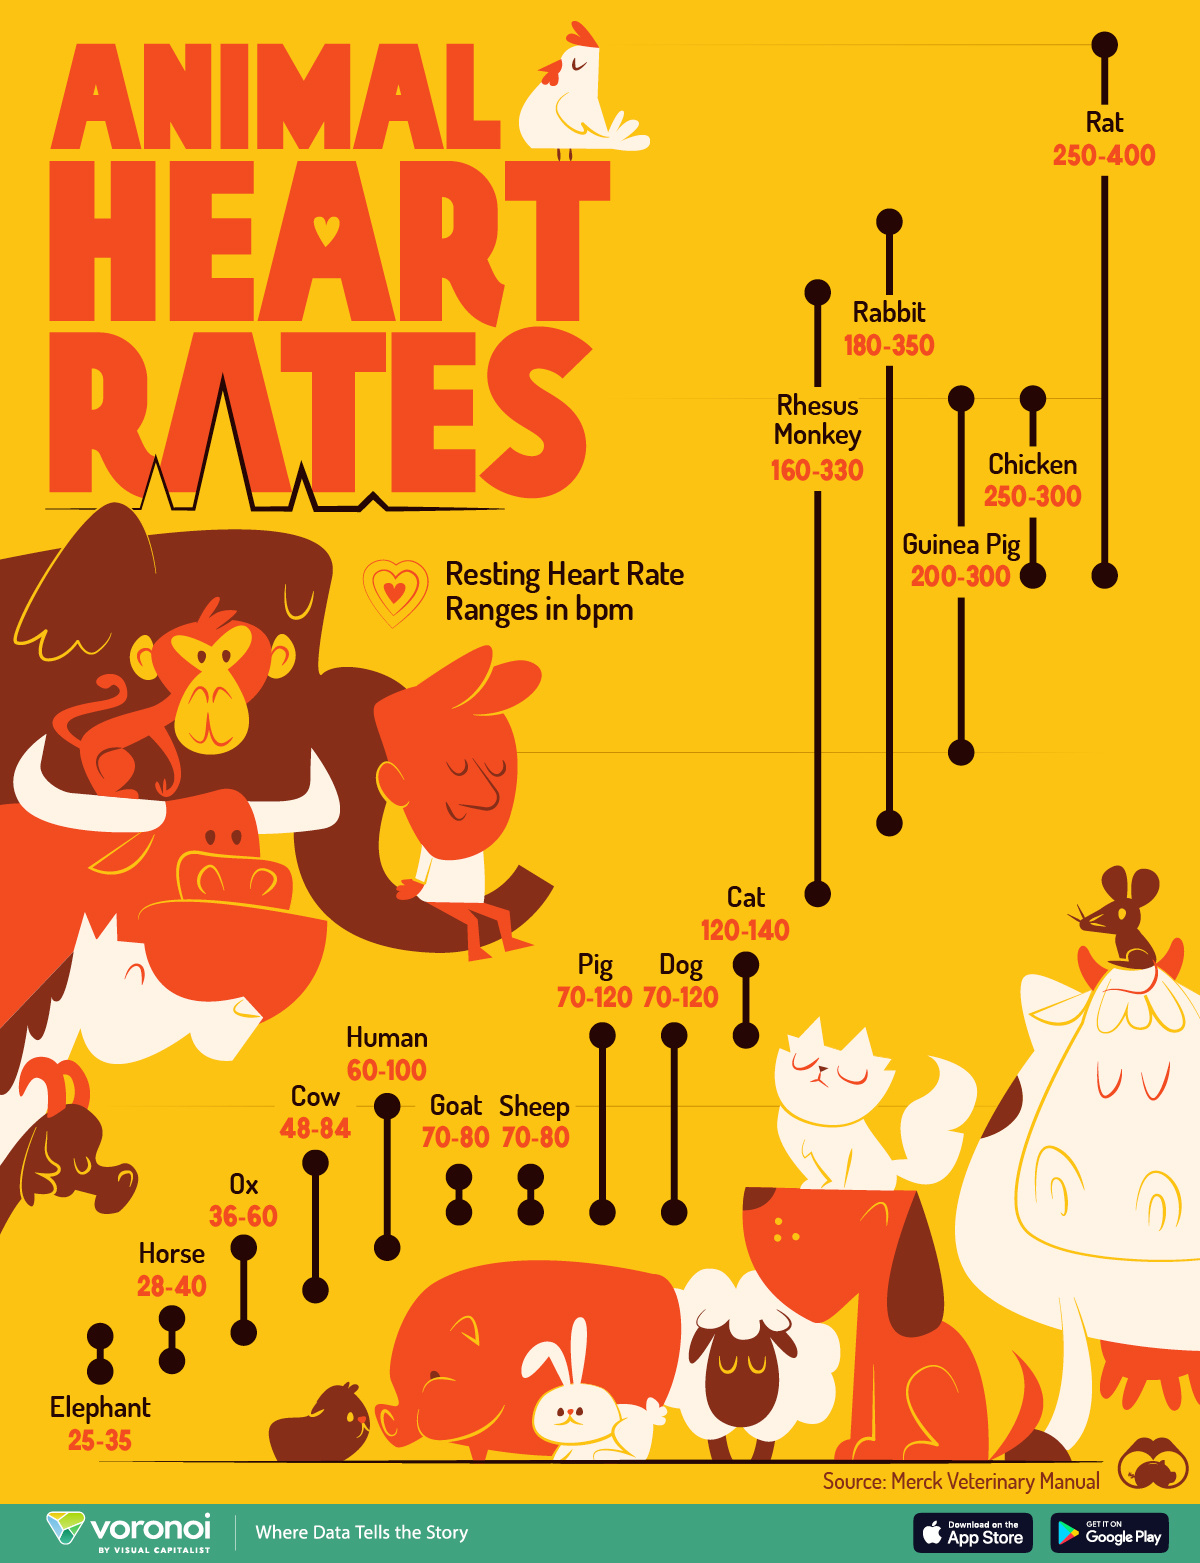
You are here

Health

Visualizing the Composition of Blood

The Composition of Blood

Have you ever wondered what blood is made up of?

With the average adult possessing five to six liters of blood in the body, this fluid is vital to our lives, circulating oxygen through the body and serving many different functions.

Despite its simple, deep-red appearance, blood is comprised of many tiny chemical components. This infographic visualizes the composition of blood and the microscopic contents in it.

Florida Department of Health: Men Ages 18 to 39 Should Not Take mRNA Coronavirus Shots

Florida continues to be the leader among American states in opting out of the push that everyone takes the experimental coronavirus “vaccine” shots. Back in March, the Florida Department of Health advised that healthy children of ages 5 to 17 may not benefit from the coronavirus shots. Meanwhile, other states were executing full-out campaigns to give the shots to as many children as possible. Then, in June, the Florida government made the bold choice to be the only state government to refuse to distribute the newly-available coronavirus shots for children four year old and younger.

CDC Takes a Step Back in Its Push for Mask Wearing at Health Care Facilities

Sanity and freedom has returned at most places many Americans visit, with masks mandated signs, and even masks recommended signs, having been removed. But, at many health care facilities across the country mask mandates have remained in force. The continuation of mask mandates at health care facilities is especially infuriating because, for our health’s sake, we would hope the people running these places would have understood from early on that the masks both cause health problems and are not shown to provide net protection against coronavirus.

How Do Americans Spend Their Money, By Generation?

How Americans Spend Their Money, By Generation

In 2021, the average American spent just over $60,000 a year. But where does all their money go? Unsurprisingly, spending habits vary wildly depending on age.

This graphic by Preethi Lodha uses data from the U.S. Bureau of Labor Statistics to show how average Americans spend their money, and how annual expenses vary across generations.

A Generational Breakdown of Overall Spending

Pages