![]()
See this visualization first on the Voronoi app.
Use This Visualization
Chart: What’s Powering New U.S. Electricity Generation?
This was originally posted on our Voronoi app. Download the app for free on iOS or Android and discover incredible data-driven charts from a variety of trusted sources.
Key Takeaways
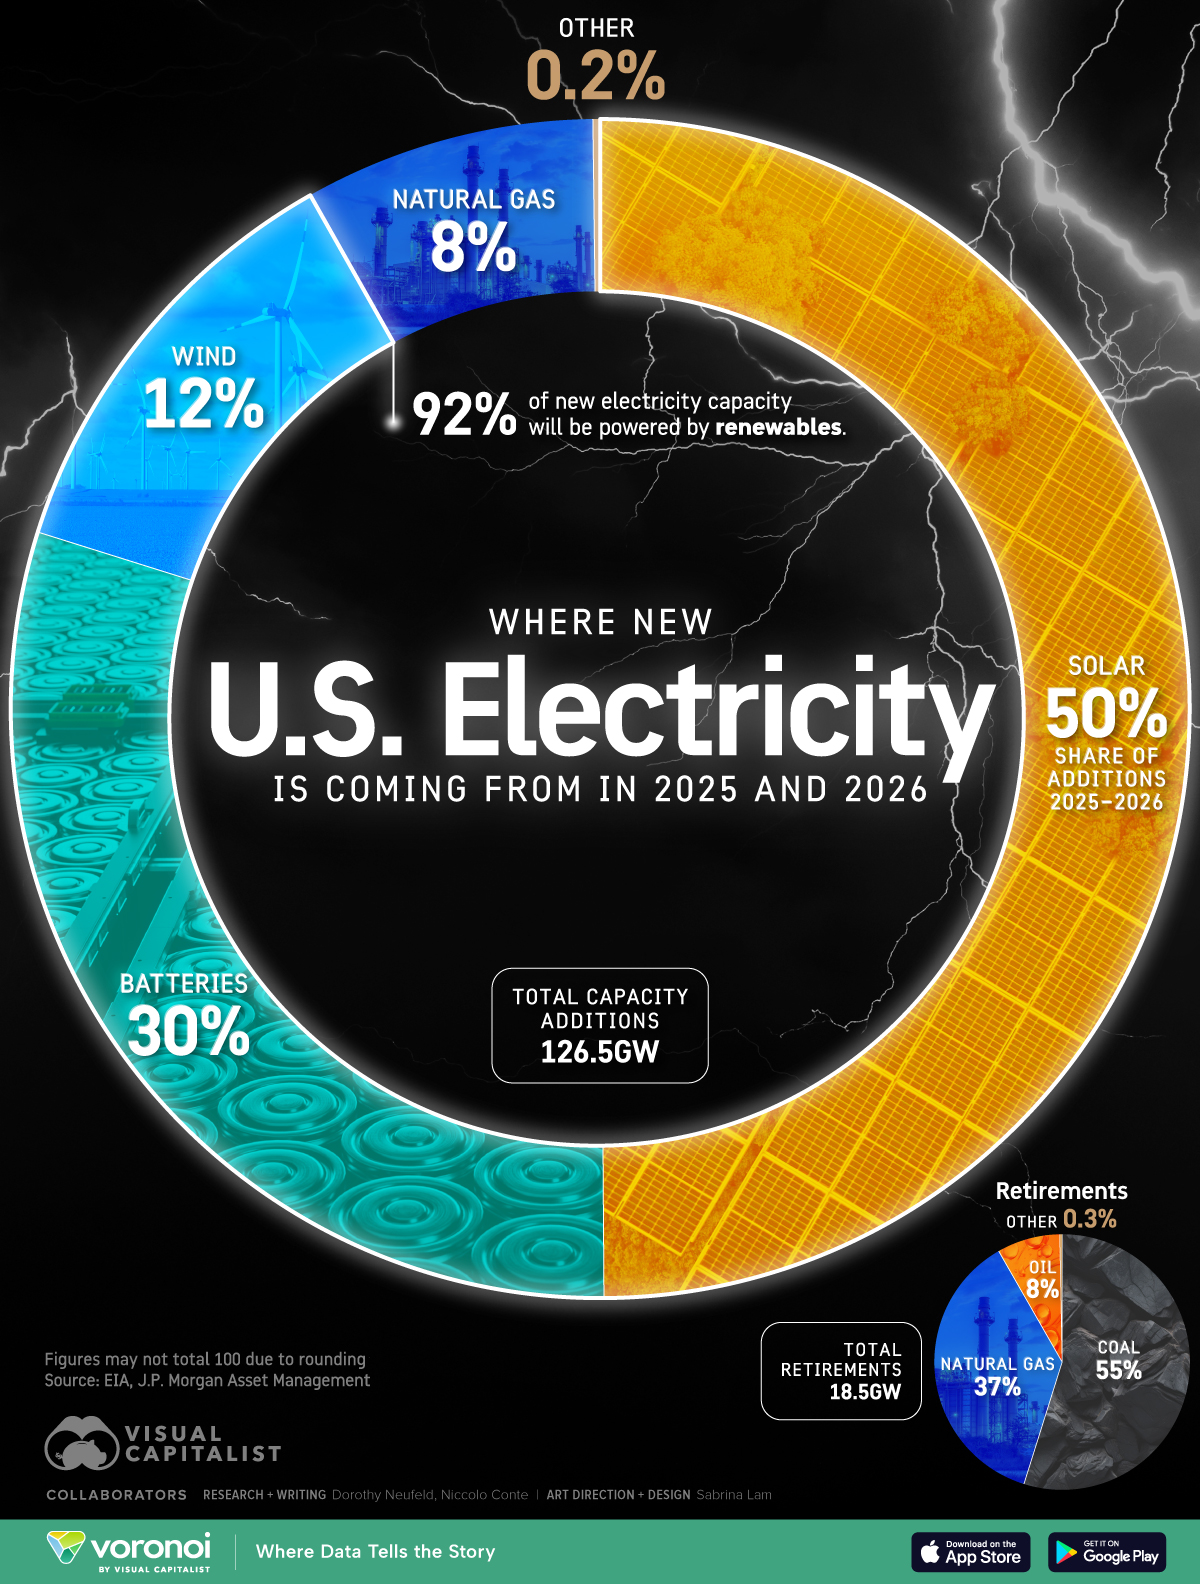
- Between 2025 and 2026, renewables account for the lion’s share of new U.S. electricity additions.
- Solar accounts for 50% of new U.S. electricity generation, driven by declining prices supporting its cost competitiveness.
- By contrast, natural gas makes up just 8% of new additions, while remaining fossil fuel sources of energy make up less than 0.2% of the total share.
U.S. electricity generation is decarbonizing as demand for green power surges.
In the next two years, renewable sources will power 92% of new electricity capacity. Driving this shift are massive investments from big tech companies to scale their AI infrastructure, requiring a huge amount of power to run and cool data centers.
This visualization is part of Visual Capitalist’s VOLTage Week, sponsored by Tema ETFs. It shows where new U.S. electricity capacity is coming from, based on data from the EIA via J.P. Morgan Asset Management.
Breaking Down New U.S. Electricity Generation
Below, we show planned U.S. electricity additions by source for 2025 and 2026:
| Source | % of Additions 2025-2026 | GW Added |
|---|---|---|
| Solar | 50% | 63.3 |
| Batteries | 30% | 38.0 |
| Wind | 12% | 15.2 |
| Natural gas | 8% | 10.1 |
| Other | 0.2% | 0.3 |
| Total Additions | 100% | 126.5 |
As we can see, solar power accounts for 50% of new capacity additions in the next two years.
While natural gas continues to be the leading source of electricity in the U.S., solar is rapidly growing. In 2024, solar power additions hit a record 37 gigawatts (GW) in new capacity compared to 1 GW of new capacity for natural gas-fired power.
With 30% of new capacity, battery storage follows next. In the next two years, new storage capacity is set to reach 38 GW of power, with projects concentrated in Texas and California.
Meanwhile, the majority of U.S. electricity retirements are coal (55%), natural gas (37%), and oil (8%) through to 2026.
Learn More on the Voronoi App ![]()
To learn more about trends in renewable energy, check out this graphic on the declining cost of renewable power.