You are here

S&P 500

What Happens When The Market Goes Nowhere For One Year (Hint: Nothing Good)
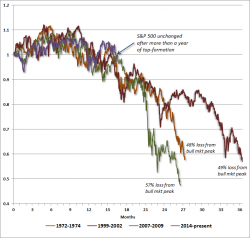
What Happens When The Market Goes Nowhere For One Year (Hint: Nothing Good)

Excerpted from John Hussman's Weekly Market Comment,

The single most important quality that investors can have, at present, is the ability to maintain a historically-informed perspective amid countless voices chanting “this time is different” and arguing that long-term investment returns have no relationship to the price that one pays.
Futures Rebound On Weaker Yen; Oil Hits 2016 Highs

Futures Rebound On Weaker Yen; Oil Hits 2016 Highs

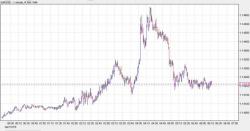
In recent days, we have observed a distinct trading pattern: a ramp early in the US morning, usually triggered by some aggressive momentum ignition, such as today's unexplained pump then dump in the EURUSD...


... with stocks rising after the European open, rising throughout the US open, then peaking around the time the US closed at which point it is all downhill for the illiquid market.

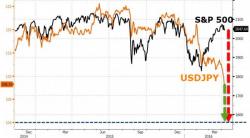
"Mr. Yen" Warns USDJPY May Hit 100 By Year-End

"Mr. Yen" Warns USDJPY May Hit 100 By Year-End

Having correctly predicting the yen’s advance beyond 115 and then 110 per dollar, former Japanese Finance Minister Eisuke Sakakibara now says Japan’s currency may strengthen to 100 by year-end.

As Bloomberg reports, having been in charge of currency intervention in Japan, Sakakibura was dubbed Mr. Yen for his ability to influence the exchange rate in the 1990s, seems to suggest - uinlike Suga overnight - that intervention is unlikely (or unlikley to be successful).

What The Charts Say: 15 "Risks" To The Recent Rally

What The Charts Say: 15 "Risks" To The Recent Rally

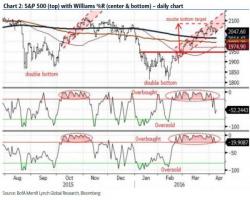
The stock surge from February is at risk, warns BofAML's Stephen Suttmeier as a plethora of bearish divergences could cap further gains from here. 2044-2022 are key nearby S&P 500 support for April, but a loss of 2022 is required to break the last higher low from 3/24 and suggest a deeper decline for the S&P 500. The following 15 risk-factors - from VIX term structure steepness to Dow Theory Sell signals - all point to a retest of the recent 1810-1820 lows.

Pages