Authored by Wolf Richter via WolfStreet.com,
Breath-taking differences in a vast country.
The Census Bureau released another data trove this week for 2016, based on the American Community Survey. Among many other data points, the survey details median household incomes by geographic location, such as by metro area, county, or state. And they show just how enormous the income differences in the US are from city to city.
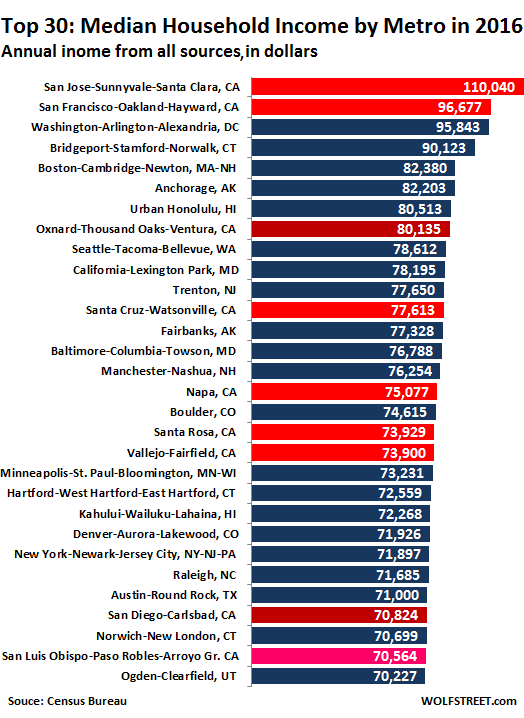
Of the 382 metropolitan statistical areas (MSA) that the US government recognizes, the median income of $110,000 in Silicon Valley is over three times the median income of $35,600 in Laredo, TX.
These MSAs can be large. For example, the extended San Francisco Bay Area is divided in several metros including the two biggest:
- San Jose-Sunnyvale-Santa Clara, which is the southern portion of Silicon Valley and includes Palo Alto.
- San Francisco-Oakland-Hayward, which includes five counties (San Francisco, Alameda, Marin, Contra Costa, and San Mateo) that make up the northern part of Silicon Valley, San Francisco, parts of the East Bay, and a part of the North Bay.
These two are also the metros that had the highest median household incomes in the US in 2016, of $110,040 and $96,677 respectively.
“Household income” is income by all household members and from all sources of money, including “earnings” (wages, salaries, and the like) and investment income such as interest, dividends, and rents (#11-#13):
- Earnings
- Unemployment compensation
- Workers’ compensation
- Social security
- Supplemental security income
- Public assistance
- Veterans’ payments
- Survivor benefits
- Disability benefits
- Pension or retirement income
- Interest
- Dividends
- Rents, royalties, and estates and trusts
- Educational assistance
- Alimony
- Child support
- Financial assistance from outside of the household
- Other income
Below are the 30 metros in the US with the highest household incomes. Those in California are color-coded: bright red for the extended Bay Area, burgundy (sort of) for Southern California, and neon-pink for the Central Coast.
In total, nine of the 30 metros with the highest median incomes are in California. There are many up and down the East Coast and a number of them in the middle of the country. Hawaii has two metros on the list, as has Alaska. But even within the top 30, the median household income of Number One is 57% higher than that of Number 30:
Below here are the 30 of the 382 metros with the lowest median household incomes. Note these lists represent the extremes in the US. There are 322 MSAs in between the two lists, and their income levels cluster closely around the national median household income:
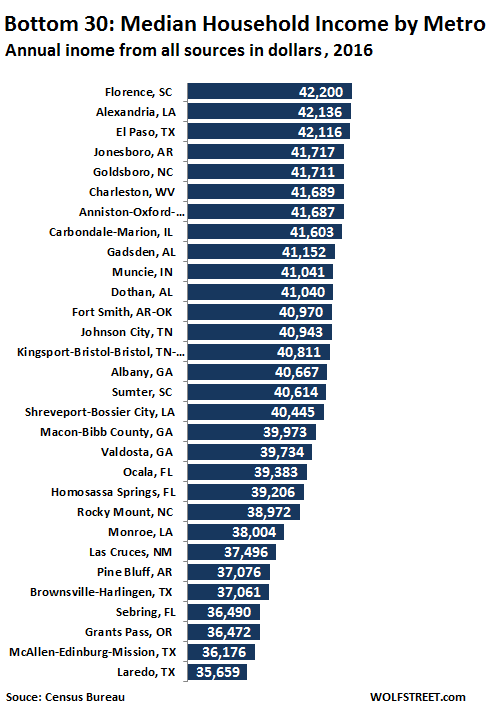
The comparison shows just how vast the income differences by geographical regions are in a vast country, and it also explains a host of other differences, such as home prices and rents, where $1.2 million, for example, buys a median condo in San Francisco (these are nothing special) or a palatial house in Laredo, TX.
But “median household income” is an aggregate number that hides as much as it reveals. Here are some details. Read… The Chilling Fact “Record Median Household Income” is Hiding