![]()
See more visuals like this on the Voronoi app.
 ”
”
Use This Visualization
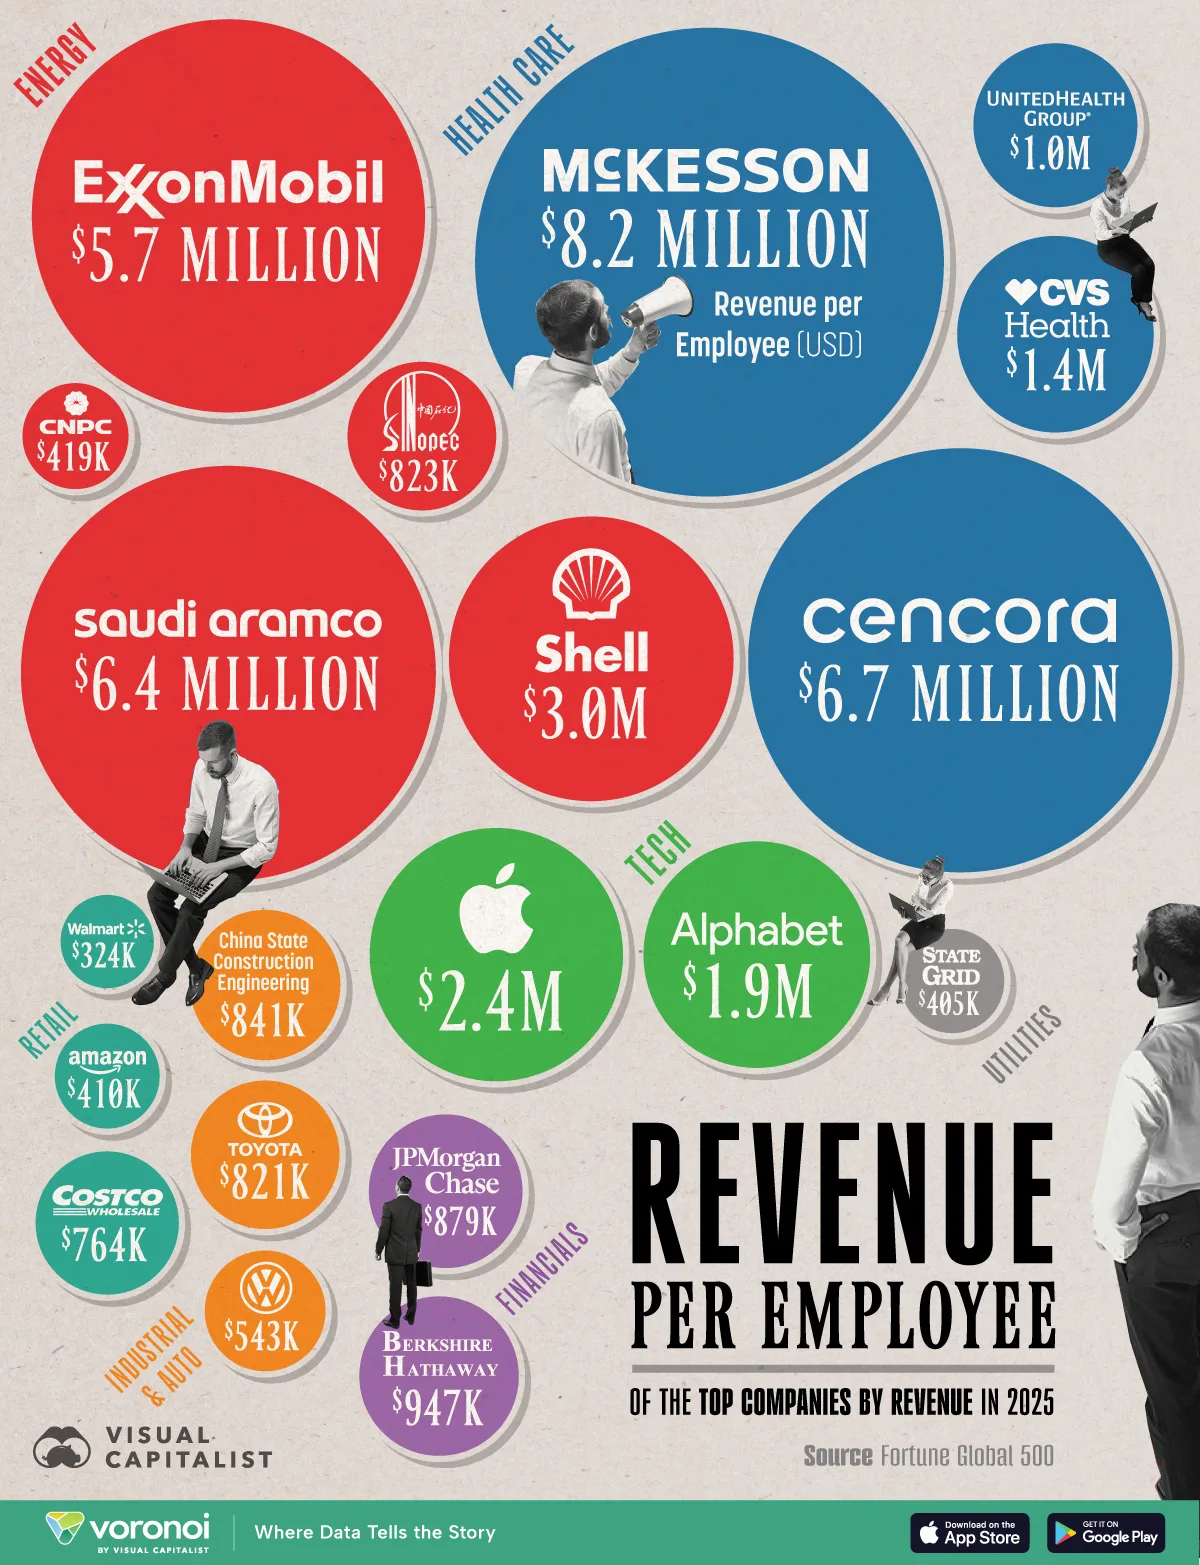
Ranked: Revenue per Employee of the World’s Largest Companies
This was originally posted on our Voronoi app. Download the app for free on iOS or Android and discover incredible data-driven charts from a variety of trusted sources.
Key Takeaways
- McKesson, a pharmaceutical distributor, makes more than $8.1 million in revenue per employee.
- Exxon Mobil and Saudi Aramco generate $5.7 million and $6.4 million in revenue per employee, respectively.
- Walmart, the largest company by revenue, generates less than $350,000 in revenue per employee.
Even for the world’s largest companies by revenue, the efficiency of operations and sales differs drastically. While some companies rely on vast workforces, others achieve massive revenues with comparatively lean teams.
Revenue per employee is one of the straightforward ways to measure how efficiently a company converts its workforce into sales.
This infographic uses data from the Fortune Global 500 to highlight the revenue per employee of the world’s largest companies by revenue for fiscal years ending on or before March 31, 2025.
Which Companies Lead in Revenue per Employee?
Among the world’s top 20 largest companies by revenue, the annual revenue per employee ranges from about $324,000 to $8.1 million. Here’s how they stack up:
| Company | Revenue per employee | Revenue (F.Y. ending March 31, 2025) |
Employees |
|---|---|---|---|
| McKesson | $8,160,250 | $359,051,000,000 | 44,000 |
| Cencora | $6,680,877 | $293,958,600,000 | 44,000 |
| Saudi Aramco | $6,392,522 | $480,193,500,000 | 75,118 |
| Exxon Mobil | $5,740,312 | $349,585,000,000 | 60,900 |
| Shell | $3,010,719 | $289,029,000,000 | 96,000 |
| Apple | $2,384,360 | $391,035,000,000 | 164,000 |
| Alphabet | $1,909,297 | $350,018,000,000 | 183,323 |
| CVS Health | $1,436,644 | $372,809,000,000 | 259,500 |
| UnitedHealth Group | $1,000,695 | $400,278,000,000 | 400,000 |
| Berkshire Hathaway | $946,567 | $371,433,000,000 | 392,400 |
| JPMorgan Chase | $879,183 | $278,906,000,000 | 317,233 |
| China State Construction Engineering | $841,861 | $304,121,300,000 | 361,249 |
| Sinopec Group | $823,053 | $407,490,100,000 | 495,096 |
| Toyota Motor | $820,914 | $315,110,200,000 | 383,853 |
| Costco Wholesale | $764,123 | $254,453,000,000 | 333,000 |
| Volkswagen | $543,067 | $351,093,300,000 | 646,501 |
| China National Petroleum | $418,863 | $412,645,300,000 | 985,155 |
| Amazon | $409,999 | $637,959,000,000 | 1,556,000 |
| State Grid | $404,940 | $548,414,400,000 | 1,354,310 |
| Walmart | $324,279 | $680,985,000,000 | 2,100,000 |
Wholesale pharmaceutical distributors such as McKesson ($8.1 million per employee) and Cencora ($6.7 million) dominate the top of the list, reflecting their lean and efficient business models.
Energy giants also post strong results, with Saudi Aramco ($6.4 million) and Exxon Mobil ($5.7 million) leading their sector. Meanwhile, among technology firms, Apple brings in around $2.4 million per employee, while Alphabet generates $1.9 million.
On the other end of the spectrum, massive employers such as Walmart (2.1 million employees), Amazon (1.6 million employees), and China’s State Grid (1.4 million employees) post much lower per-employee revenue.
The Leading Industries for Revenue per Employee
Looking at industries, four of the top 10 companies by revenue per employee are in the healthcare space, with McKesson and Cencora operating as distributors, while CVS Health is primarily a pharmaceutical retailer.
The capital-intensive energy sector also fares well, making up three of the top 10 companies, followed by the technology sector, where companies benefit from the scalability of digital platforms and product ecosystems.
On the other hand, the retail industry, including wholesalers like Costco and Walmart, typically relies on large workforces that reduce the revenue generation per employee, despite their massive scales.
Learn More on the Voronoi App ![]()
If you enjoyed today’s post, check out The World’s Largest Companies by Revenue on Voronoi, the new app from Visual Capitalist.