Via Dana Lyons' Tumblr,
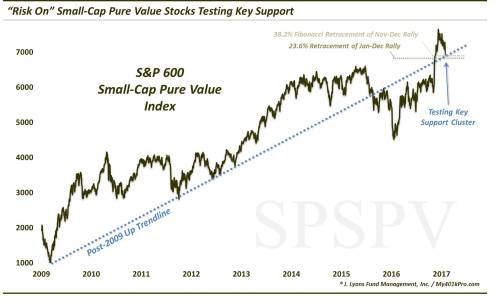
Small-Cap Pure Value stocks – a fair barometer of investor risk appetite – are testing key support.
As affirmation of a rising stock market, one thing we like to see is the typically riskier segments of the market participating, or preferably, leading. When such leaders of so-called “risk-on” environments are performing well, it is a sign of a healthy investor appetite for risk. And, of course, the collective willingness by investors to assume risk is essentially what enables rising prices. And while the leaders of risk-on markets can change over cycles, small-caps are typically among the group. We have found this characteristic especially true of small-cap pure value stocks.
This segment, as represented by the S&P 600 Small-Cap Pure Value Index (SPSPV) often leads the market higher during bull markets and lower during bears. A good example was a year ago when SPSPV led the market rout lower into January – and then higher in the subsequent recovery. We have found it to be the case in recent months as well.
During the post-election “Trump Rally”, the SPSPV ripped higher by 30% in just 25 days, doubling the average performance of its fellow small, mid and large-cap growth and value style brethren. However, during the 33-day consolidation since then, the index has dropped over 8%, more than double any of the other style segments. So you can see why it would be in the bulls’ best interest to have this segment of the market moving upward.
And that notion makes the S&P 600 Small-Cap Pure Value’s present test of multiple support levels a potentially important factor in determining the immediate fate of the post-election rally.
As the chart shows, several key charting analytics line up in the vicinity of current prices ~6900. These include:
- The post-2009 bull market Up trendline that served as support until mid-2015 – and perhaps again after reclaiming it in the immediate aftermath of the election.
- The 23.6% Fibonacci Retracement of the January-December 2016 rally
- The 38.2% Fibonacci Retracement of the November-December 2016 post-election rally
Should this level fail to hold, it doesn’t mean that the post-election rally is doomed. However, there is a strong possibility that it would be put on hold temporarily while a deeper retracement unfolds. In the case of the SPSPV, that would likely take the index down to the 6400-6500 level, or 6-7% lower, corresponding with the next sequence of Fibonacci levels as well as the post-election breakout area. If the SPSPV does hold here (its low today was 6927), its may resume its next leg higher in short order – along with much of the rest of the market that is sitting just below all-time highs.
Either way, these small-cap pure value stocks tend to lead the market up or down – so be on guard.
* * *
More from Dana Lyons, JLFMI and My401kPro.