![]()
See this visualization first on the Voronoi app.
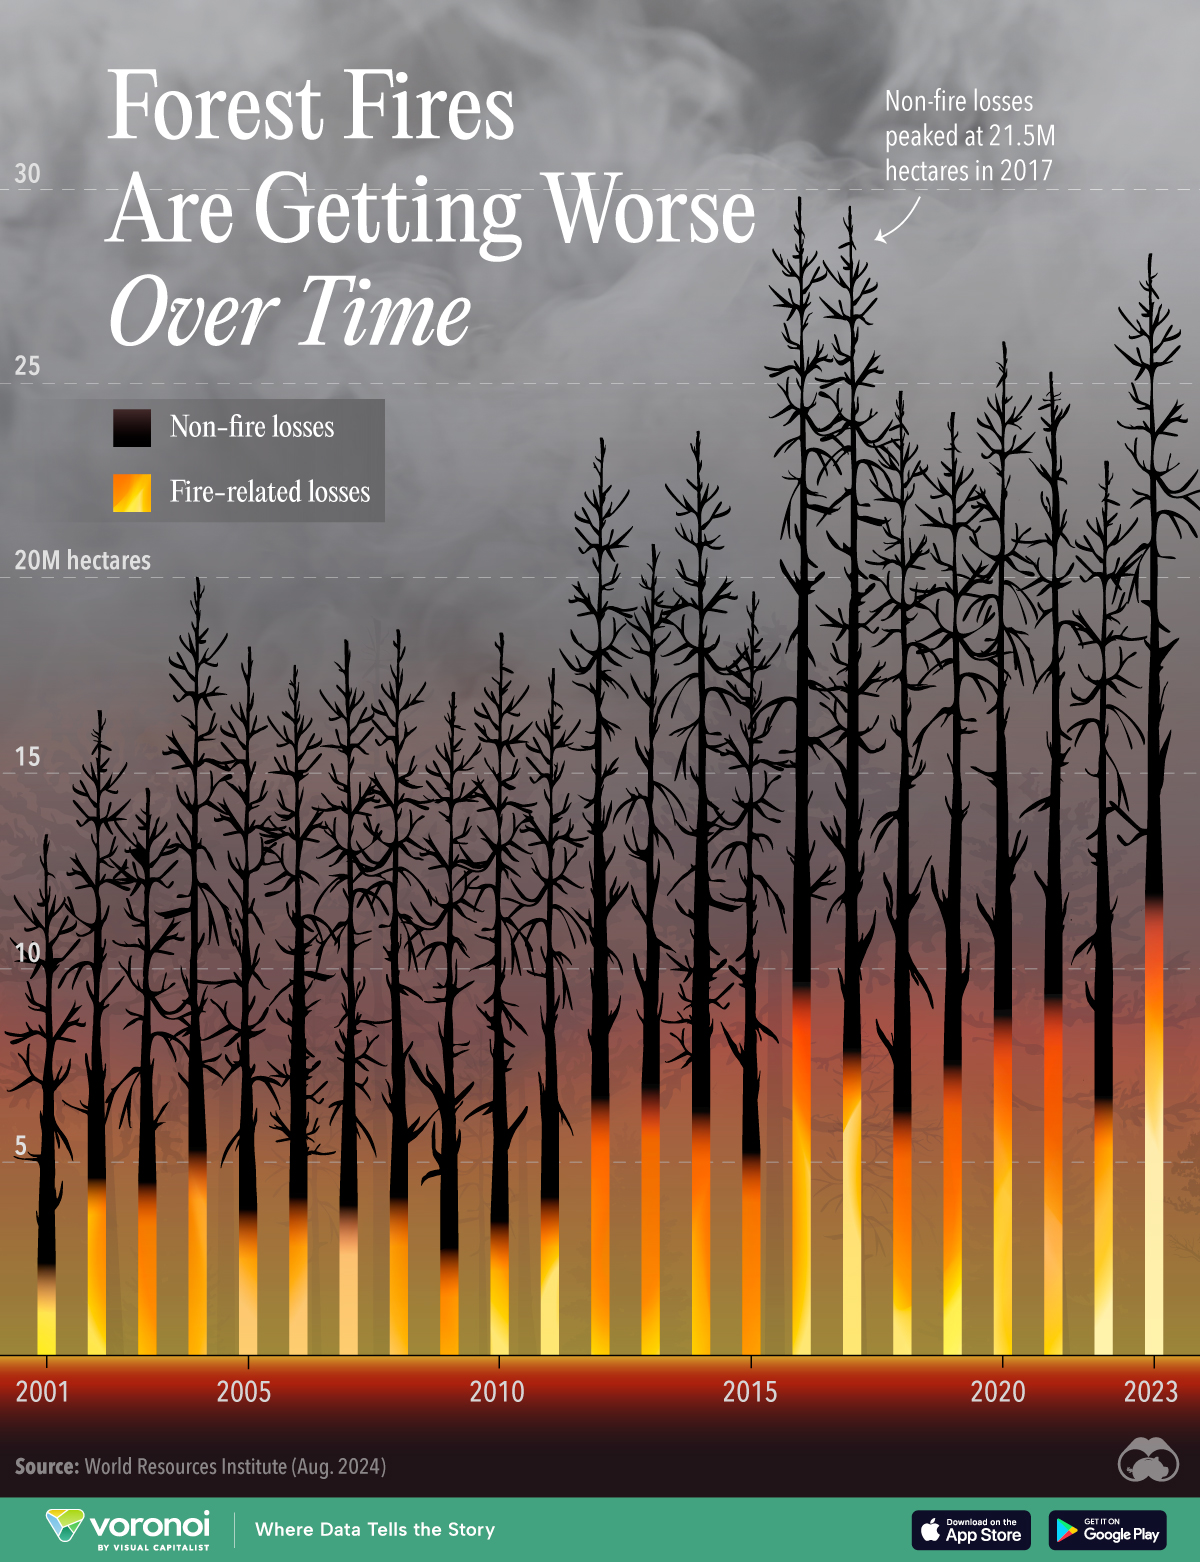
Chart: Damage Caused by Global Forest Fires (2001-2023)
This was originally posted on our Voronoi app. Download the app for free on iOS or Android and discover incredible data-driven charts from a variety of trusted sources.
This graphic shows the number of hectares lost each year to global forest fires, based on recent data published by the World Resources Institute (WRI).
The dark part of the trees represents forest loss from non-fire related causes, while the bright portion is forest loss due to fire.
Data and Methodology
To collect this data, researchers at the University of Maryland used Landsat satellite imagery to map the area of tree cover lost to stand-replacing forest fires (fires that kill all or most of the living overstory in a forest) annually from 2001 to 2023.
| Year | Fire-related losses (million hectares) |
Non-fire losses (million hectares) |
Fire share of total losses (%) |
|---|---|---|---|
| 2001 | 2.5 | 10.8 | 19% |
| 2002 | 4.6 | 11.9 | 28% |
| 2003 | 4.5 | 10.0 | 31% |
| 2004 | 5.4 | 14.5 | 27% |
| 2005 | 3.9 | 14.2 | 22% |
| 2006 | 4.2 | 13.5 | 24% |
| 2007 | 4.0 | 14.4 | 21% |
| 2008 | 4.2 | 14.4 | 23% |
| 2009 | 2.9 | 14.1 | 17% |
| 2010 | 3.6 | 14.9 | 20% |
| 2011 | 4.2 | 13.4 | 24% |
| 2012 | 6.7 | 16.8 | 28% |
| 2013 | 7.0 | 13.7 | 34% |
| 2014 | 6.4 | 17.3 | 27% |
| 2015 | 5.3 | 14.3 | 27% |
| 2016 | 9.6 | 20.1 | 32% |
| 2017 | 7.9 | 21.5 | 27% |
| 2018 | 6.4 | 18.3 | 26% |
| 2019 | 7.6 | 16.6 | 31% |
| 2020 | 8.9 | 17.0 | 34% |
| 2021 | 9.3 | 15.9 | 37% |
| 2022 | 6.7 | 16.1 | 29% |
| 2023 | 11.9 | 16.3 | 42% |
While the number of hectares burned varies each year, we can see there has been a clear upward trend since 2001. For example, 2020, 2021, and 2023 were the fourth, third, and first worst years in the dataset for forest fires globally.
2023’s losses were partly driven by Canada, which contains nearly 9% of the world’s forests. The country lost a massive 7.8 million hectares in 2023 due to fires.
Why Are Fires Becoming Worse?
According to the WRI, climate change is a major reason the damage caused by global forest fires is increasing. For example, extreme heat waves are five times more likely today than they were 150 years ago.
This is due to the climate feedback loop, where increasing emissions drive hotter and drier conditions, which in turn cause more fires.
When forests burn, the carbon that was stored in their trunks, branches, and leaves is released into the atmosphere. This release of carbon further drives hotter and drier conditions.
Learn More on the Voronoi App ![]()
If you enjoyed this post, check out this graphic that breaks down global carbon emissions by country.
The post Chart: Damage Caused by Global Forest Fires (2001-2023) appeared first on Visual Capitalist.