![]()
See this visualization first on the Voronoi app.
Use This Visualization
Charted: American Income vs. Home Prices (1985–2025)
This was originally posted on our Voronoi app. Download the app for free on iOS or Android and discover incredible data-driven charts from a variety of trusted sources.
Key Takeaways
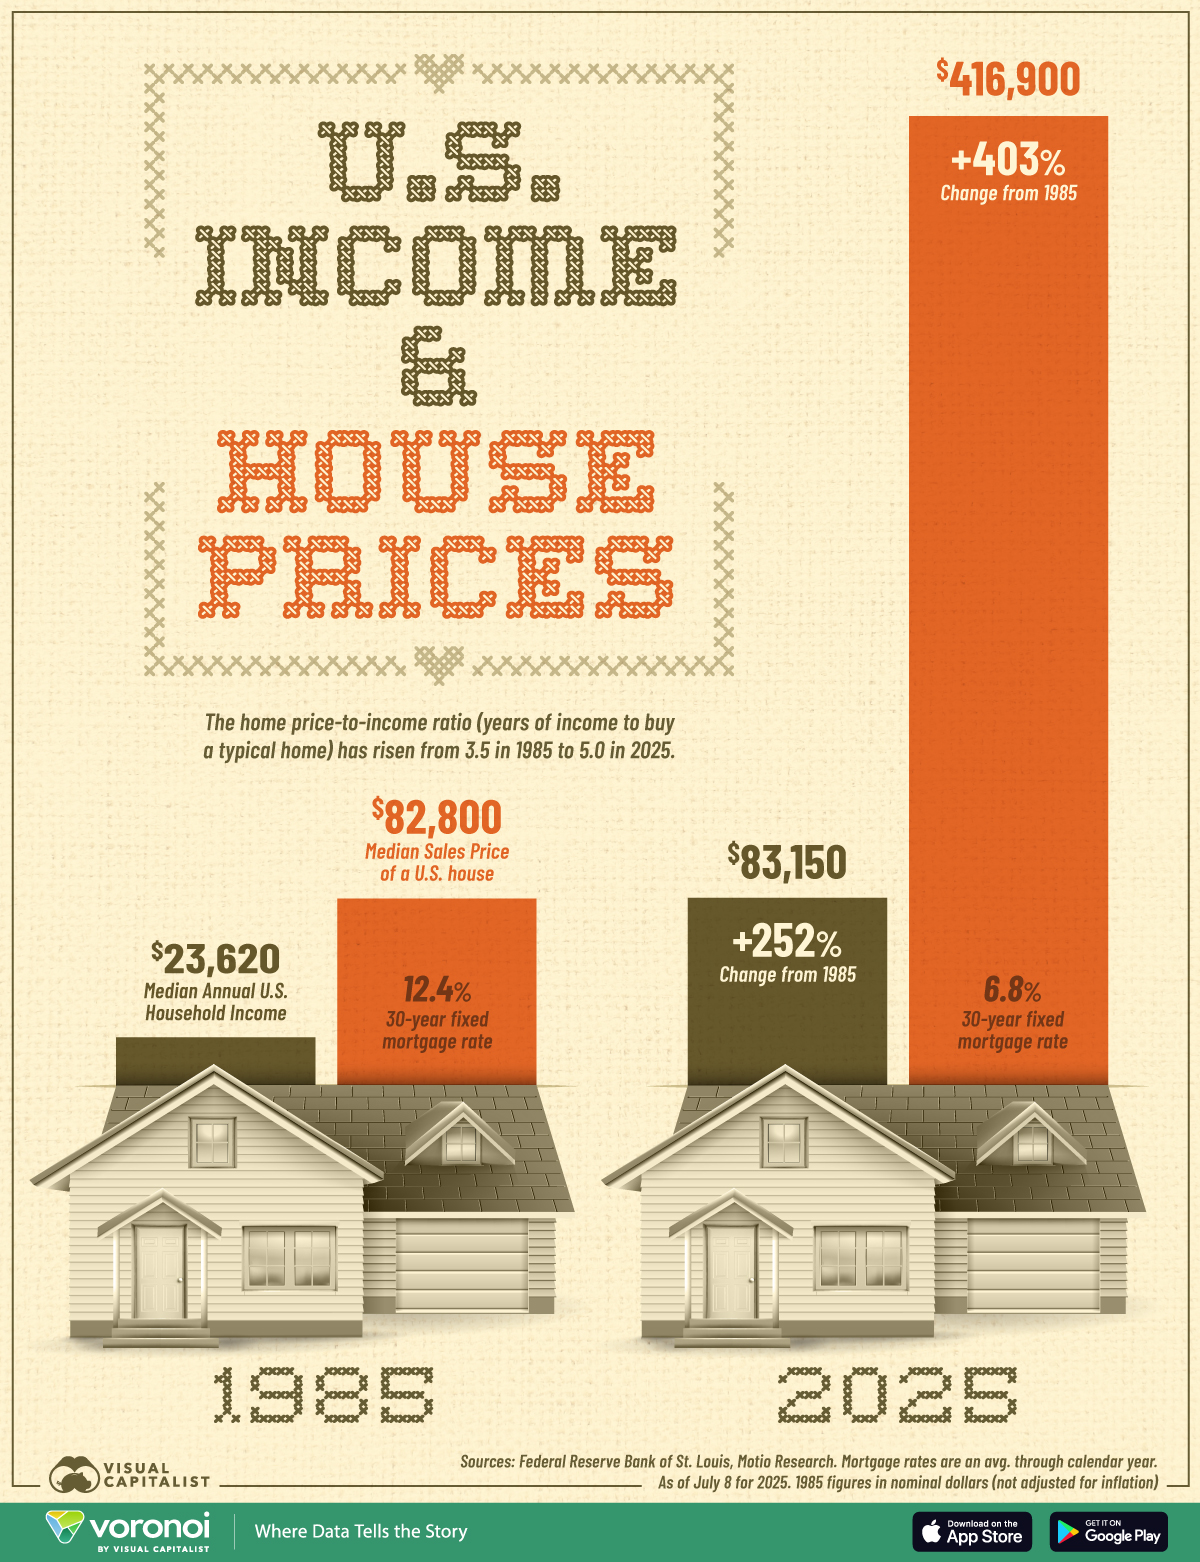
- America’s median home price-to-income ratio has risen from 3.5 in 1985 to 5.0 in 2025.
- In 2025, the median price for an American home is $416,900, up from $82,800 in 1985.
- 30-year fixed mortgage rates have reduced from 12.4% to 6.8% between 1985 and 2025.
Buying a home in America isn’t for the faint-hearted, with the salary needed to buy a home doubling from 2017 to 2025.
However, while home prices have risen strongly, wage growth hasn’t kept up, widening the home affordability gap.
This infographic compares the median American household income with the median sales price of a home in 1985 and 2025, using nominal figures (not adjusted for inflation).
It also shows the 30-year fixed mortgage rate, the benchmark cost of borrowing for most home buyers. The data comes from the Federal Reserve Bank of St. Louis (FRED) and Motio Research.
America’s Home Affordability Gap
The home price-to-income ratio of America has grown significantly over the last few decades.
In 1985, the median U.S. home cost $82,800, while the median household earned $23,620 annually—a ratio of roughly 3.5x income. Here’s how that gap has widened over four decades:
| Year | Median Annual Household Income | Median Sales Price of U.S. Houses | 30-year fixed mortgage rate |
|---|---|---|---|
| 1985 | $23,620 | $82,800 | 12.4% |
| 2025 | $83,150 | $416,900 | 6.8% |
| Change | +252% | +403% | -5.6 pp |
As of 2025, the median American home costs $416,900, five times the median annual household income of $83,150.
Meanwhile, the 30-year fixed mortgage rates have nearly halved from 12.4% to 6.8% between 1985 and 2025. Theoretically, the lower cost of borrowing would make homes more affordable. However, it can also drive up demand for new housing, potentially resulting in higher prices if supply is limited.
The gap between American home prices and incomes is especially worse in coastal U.S. cities. Notably, the median home price in LA is 12.5 times the median annual household income. This ratio stands at 10.5 in San Jose and 9.8 in New York on the East Coast.
Learn More on the Voronoi App ![]()
If you enjoyed today’s post, check out The World’s Most Expensive Real Estate Markets on Voronoi, the new app from Visual Capitalist.