![]()
See this visualization first on the Voronoi app.
Use This Visualization
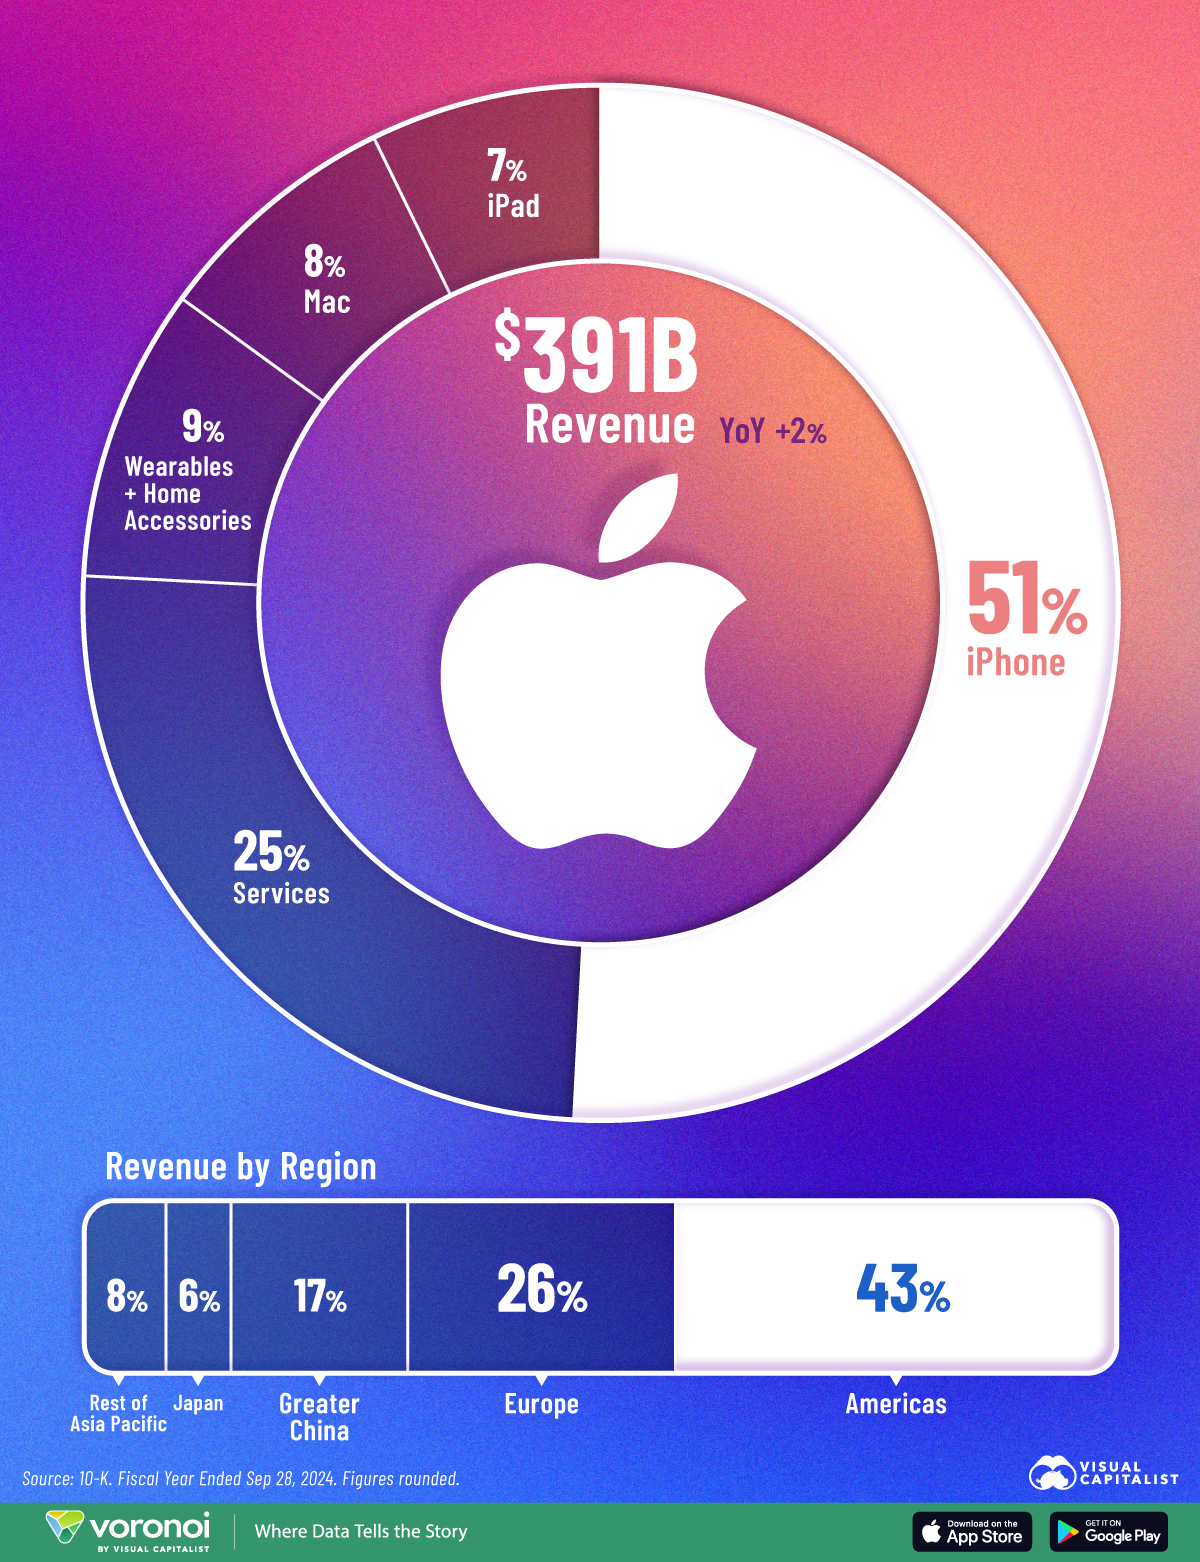
Charted: How Apple Makes its $391B in Revenue
This was originally posted on our Voronoi app. Download the app for free on iOS or Android and discover incredible data-driven charts from a variety of trusted sources.
Key Takeaways
- Apple’s revenue grew by 2% year-over-year (YoY), reaching $391 billion in the fiscal year ended September 28, 2024.
- iPhone sales accounted for more than half of Apple’s total revenue.
- The Services segment was the primary driver of revenue growth, with net sales from iCloud, App Store, and other services rising by 13% YoY.
.key-takeaways { background: #F8F9FA; border-left: 4px solid #2A6338; padding: 15px; margin: 20px 0; border-radius: 5px;}.key-takeaways h3 { margin-top: 0; color: #2A6338; font-weight: bold;}.key-takeaways ul { padding-left: 20px;}.key-takeaways li { margin-bottom: 5px;}
Apple remains one of the world’s most valuable companies, with a product ecosystem that encompasses a wide range of hardware and services.
This infographic breaks down Apple’s revenue by product category and geographical region, based on its latest 10-K filing for the fiscal year ended September 28, 2024.
Apple’s Revenue Breakdown by Product in 2024
Apple’s revenue is dominated by its iPhone and services segments, as shown in the table below:
| Category | Revenue Fiscal Year Ended Sep 28, 2024 | Share of Revenue |
|---|---|---|
| iPhone | $201.2B | 51% |
| Services | $96.2B | 25% |
| Wearables, Home and Accessories | $37.0B | 9% |
| Mac | $30.0B | 8% |
| iPad | $26.7B | 7% |
| Total Revenue | $391B | 100% |
Apple’s iPhone business accounts for over half of total revenue, raking in $201.2 billion. The other hardware segments—including Mac, iPad, and wearables (AirPods, Apple Watch, and other accessories)—make up around 24% of its revenue at $93.7 billion.
In terms of revenue growth, iPhone sales were flat relative to 2023, while hardware sales across the iPad and Wearables segments declined by 6% and 7%, respectively.
Meanwhile, Apple’s Services segment brought in $96.2 billion and saw the fastest growth, with revenue rising 13% year-over-year. This segment includes the App Store, iCloud, Apple Music, and advertising, all of which continue to benefit from Apple’s vast customer base.
Notably, services are Apple’s most profitable business, with gross margins of 73.9%—nearly double that of its hardware division (37.2%).
Apple’s Revenue by Region
Geographically, Apple’s revenue is spread across five regions, as shown below:
| Region | Revenue | Share of Revenue |
|---|---|---|
| Americas | $167.0B | 43% |
| Europe | $101.3B | 26% |
| Greater China | $67.0B | 17% |
| Japan | $25.0B | 6% |
| Rest of Asia Pacific | $30.7B | 8% |
| Total | $391B | 100% |
The Americas remain Apple’s largest market, contributing $167 billion or 43% of total revenue. Europe follows with around $101 billion, while Greater China brought in $67 billion.
However, China was the only major region to see a decline in sales (-8% YoY), while European sales rose by 7%, marking the company’s strongest regional growth.
Europe could prove to be a key battleground for Apple in the phone space, as rapidly growing Chinese phone makers like Oppo are looking to expand their presence in the region.
Learn More on the Voronoi App ![]()
If you enjoyed this infographic, check out this graphic that compares the Magnificent Seven’s Revenues on the Voronoi app.
The post Charted: How Apple Makes its $391B in Revenue appeared first on Visual Capitalist.