![]()
See this visualization first on the Voronoi app.
Use This Visualization
Charted: How Are American Universities Funded?
This was originally posted on our Voronoi app. Download the app for free on iOS or Android and discover incredible data-driven charts from a variety of trusted sources.
Key Takeaways
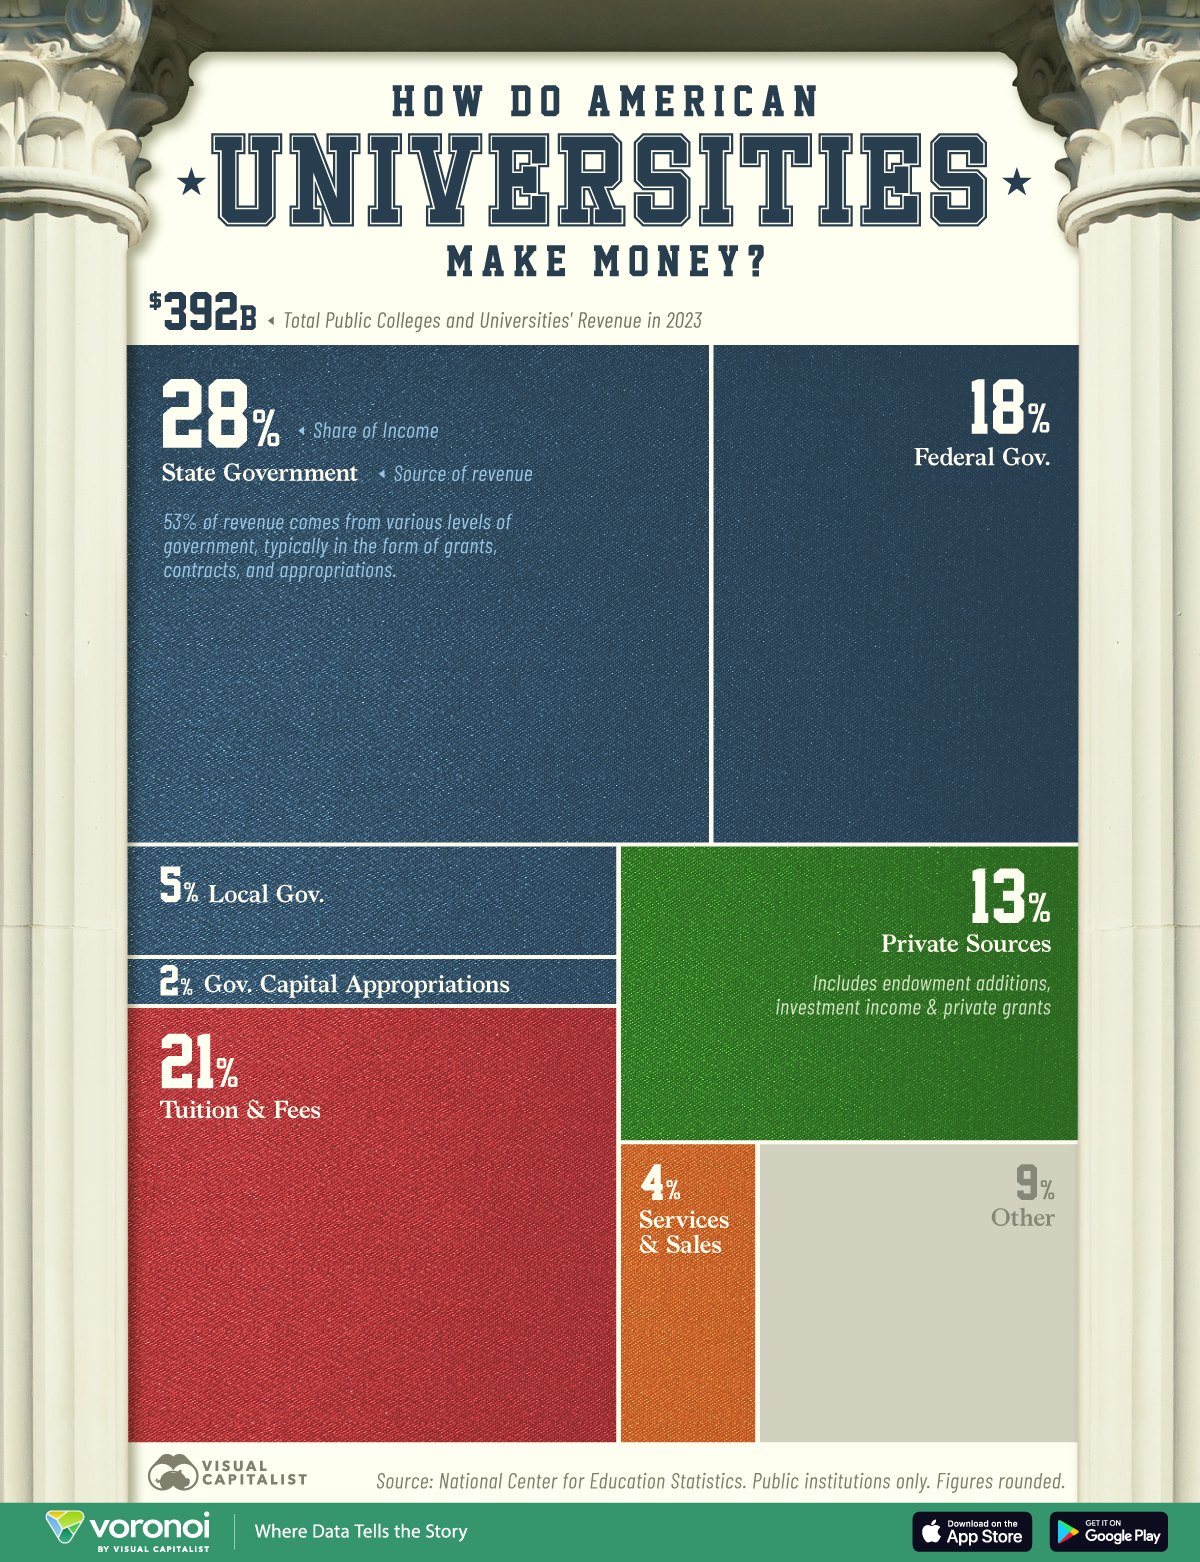
- More than half of American public college and university revenue came from government sources in 2023.
- The federal government contributed $68.9 billion, equal to 18% of total revenue.
- In April, the Trump administration froze over $10 billion in federal funding to elite universities including Harvard, Northwestern, and Cornell.
The cost of funding American universities is huge—covering everything from faculty salaries and special departments to laboratories.
Not only that, government funding for public institutions has fallen substantially over the past 50 years, making universities rely more heavily on tuition and other sources of revenue. The Trump administration’s freezing of billions in grants and contracts is adding further strain to elite academic institutions.
This graphic shows how American public universities are funded, based on data from the National Center for Education Statistics.
The Top Sources of Revenue for American Universities
Below, we break down the $392 billion in revenues generated across 1,592 public American institutions as of 2023:
| Source of Revenue | Total 2023 (B) | Share |
|---|---|---|
| State Government | $109.5 | 28% |
| Tuition and Fees | $80.8 | 21% |
| Federal Government | $68.9 | 18% |
| Private Sources | $51.2 | 13% |
| Other | $36.5 | 9% |
| Local Government | $20.7 | 5% |
| Sales and Services | $15.5 | 4% |
| Government Capital Appropriations | $9.0 | 2% |
| Total | $392 | 100% |
State government funding, typically in the form of research grants, contracts, and appropriations, makes up the largest share at 28%.
Overall, New Hampshire ranks last in spending on higher public education spending per student, followed by Vermont. Going further, 25 states spend less than levels seen in 2008, with Nevada, Arizona, and Louisiana spending 30% less in 2023.
In absolute terms, California and Texas spend the most on academic funding, at $22.3 billion and $11.5 billion, respectively in fiscal 2025.
Meanwhile, tuition and fees generated 21% of revenues totaling $80.8 billion. Despite tuition costs more than tripling since 1990, it has struggled to make up the funding losses from state cutbacks. At the same time, university spending has swelled for administrators, construction, and faculty salaries as demand for higher education has increased.
Looking at private sources of revenue, these brought in $51.2 billion, or 13% of the total. Private sources include endowment additions, investment income, and private grants. While universities have massive endowment funds, funding is often tied to specific purposes. For instance, certain donors will designate funds to scholarships or a specific research center over a series of years.
Learn More on the Voronoi App ![]()
To learn more about this topic from a global perspective, check out this graphic on the top universities outside of America.