![]()
See this visualization first on the Voronoi app.
Use This Visualization
Charted: New College Graduates’ Rising Unemployment
This was originally posted on our Voronoi app. Download the app for free on iOS or Android and discover incredible data-driven charts from a variety of trusted sources.
Key Takeaways
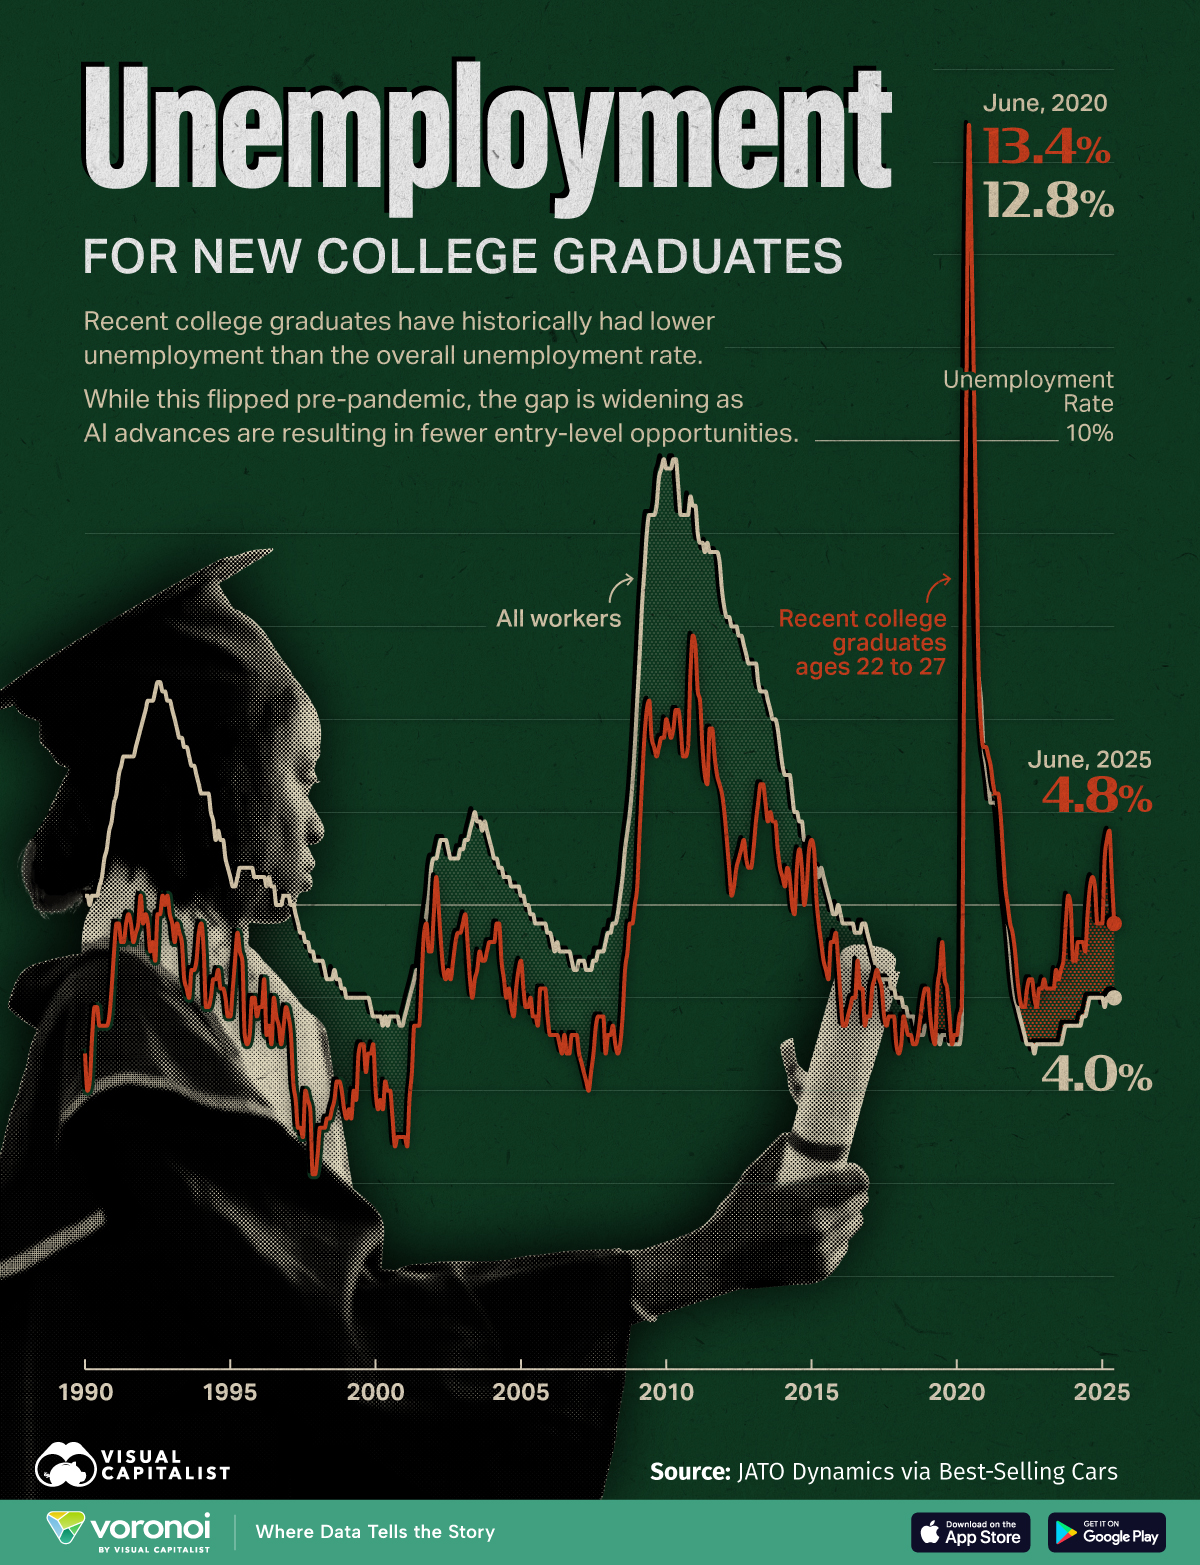
- From 1990 through most of the 2010s, new college graduates typically enjoyed lower unemployment than the overall U.S. unemployment rate.
- Just before the COVID-19 pandemic, new graduates’ unemployment rate briefly rose above the overall rate, with AI advances post-pandemic exacerbating the trend post-pandemic.
For decades, recent college graduates typically fared better in the job market than the general population.
But over the past decade this dynamic has shifted, with new graduates now facing higher unemployment rates than the overall rate.
The chart visualizes the overall U.S. unemployment rate versus that of recent college graduates (ages 22 to 27) from 1990 to June of 2025, using data from the Federal Reserve Bank of New York.
U.S. College Grads Face Higher Unemployment
From 1990 through the late 2010s, recent graduates consistently had lower unemployment rates than the broader U.S. population, however, this trend has reversed over the past decade.
The data table below shows the overall U.S. unemployment rate and the unemployment rate of new college graduates on the first month of every year, along with the latest data point available (June 2025).
| Date | U.S. overall unemployment rate | Recent college graduates ages 22 to 27 unemployment rate |
|---|---|---|
| Jan 1990 | 5.1% | 3.4% |
| Jan 1991 | 6.1% | 4.5% |
| Jan 1992 | 7.0% | 4.8% |
| Jan 1993 | 7.1% | 4.8% |
| Jan 1994 | 6.2% | 4.8% |
| Jan 1995 | 5.3% | 3.8% |
| Jan 1996 | 5.3% | 3.9% |
| Jan 1997 | 5.1% | 3.8% |
| Jan 1998 | 4.4% | 2.3% |
| Jan 1999 | 4.0% | 2.7% |
| Jan 2000 | 3.8% | 3.0% |
| Jan 2001 | 3.8% | 2.5% |
| Jan 2002 | 5.5% | 4.9% |
| Jan 2003 | 5.6% | 4.8% |
| Jan 2004 | 5.6% | 4.6% |
| Jan 2005 | 5.1% | 4.4% |
| Jan 2006 | 4.7% | 3.6% |
| Jan 2007 | 4.4% | 3.4% |
| Jan 2008 | 4.7% | 3.6% |
| Jan 2009 | 7.2% | 5.2% |
| Jan 2010 | 9.7% | 7.0% |
| Jan 2011 | 9.3% | 7.8% |
| Jan 2012 | 8.2% | 6.0% |
| Jan 2013 | 7.6% | 5.6% |
| Jan 2014 | 6.5% | 5.3% |
| Jan 2015 | 5.5% | 5.7% |
| Jan 2016 | 4.9% | 4.0% |
| Jan 2017 | 4.6% | 3.8% |
| Jan 2018 | 4.0% | 3.4% |
| Jan 2019 | 3.7% | 4.1% |
| Jan 2020 | 3.5% | 3.6% |
| Jan 2021 | 6.5% | 6.7% |
| Jan 2022 | 4.0% | 4.5% |
| Jan 2023 | 3.5% | 4.2% |
| Jan 2024 | 3.7% | 4.4% |
| Jan 2025 | 4.0% | 4.8% |
| June 2025 | 4.0% | 4.8% |
In the 1990s, the gap between overall unemployment and that of new graduates averaged around 1.7 percentage points, with new grads having the lower unemployment rate.
Even during economic downturns like the dot-com bubble bursting or the global financial crisis of 2008 and 2009, new graduates always had the lower unemployment rate.
Tougher Labor Market for New Graduates Post-Pandemic
While in late 2018 and in 2019 the new graduate unemployment rate overtook the overall U.S. unemployment rate a few times, it was the COVID-19 pandemic that solidified the full reversal.
In June 2020, graduate unemployment peaked at 13.4% while the overall U.S. unemployment rate reached 12.8%.
Since the unemployment rate has fallen back below 5% post-pandemic, new grads have continuously faced a higher unemployment rate than the overall U.S. unemployment rate.
AI Advances Leading to Fewer Entry-Level Opportunities
As of the latest data from June, 2025, new graduates now face an unemployment rate of 4.8% compared to the national overall rate of 4.0%.
While the broader economy has recovered from the COVID-19 pandemic, AI advances and employer preferences for experienced workers appear to be squeezing entry-level job prospects, resulting in a tougher entry into the labor market for new college graduates.
While some jobs are safer than others in terms of their potential for AI replacement, new graduates are having to quickly adapt to the technological advances that are changing the business landscape and overall labor market.
Learn More on the Voronoi App ![]()
To learn about how different countries’ populations view artificial intelligence advances, check out this graphic which charts global attitudes towards AI on Voronoi, the new app from Visual Capitalist.