![]()
See this visualization first on the Voronoi app.
Use This Visualization
S&P 500 Market Concentration Over 145 Years
This was originally posted on our Voronoi app. Download the app for free on iOS or Android and discover incredible data-driven charts from a variety of trusted sources.
The S&P 500, one of the leading stock market indexes in the world, tracks 500 of the largest companies listed on stock exchanges in the United States.
It covers approximately 80% of available market capitalization and is widely regarded as a key indicator of the performance of the U.S. economy and stock market.
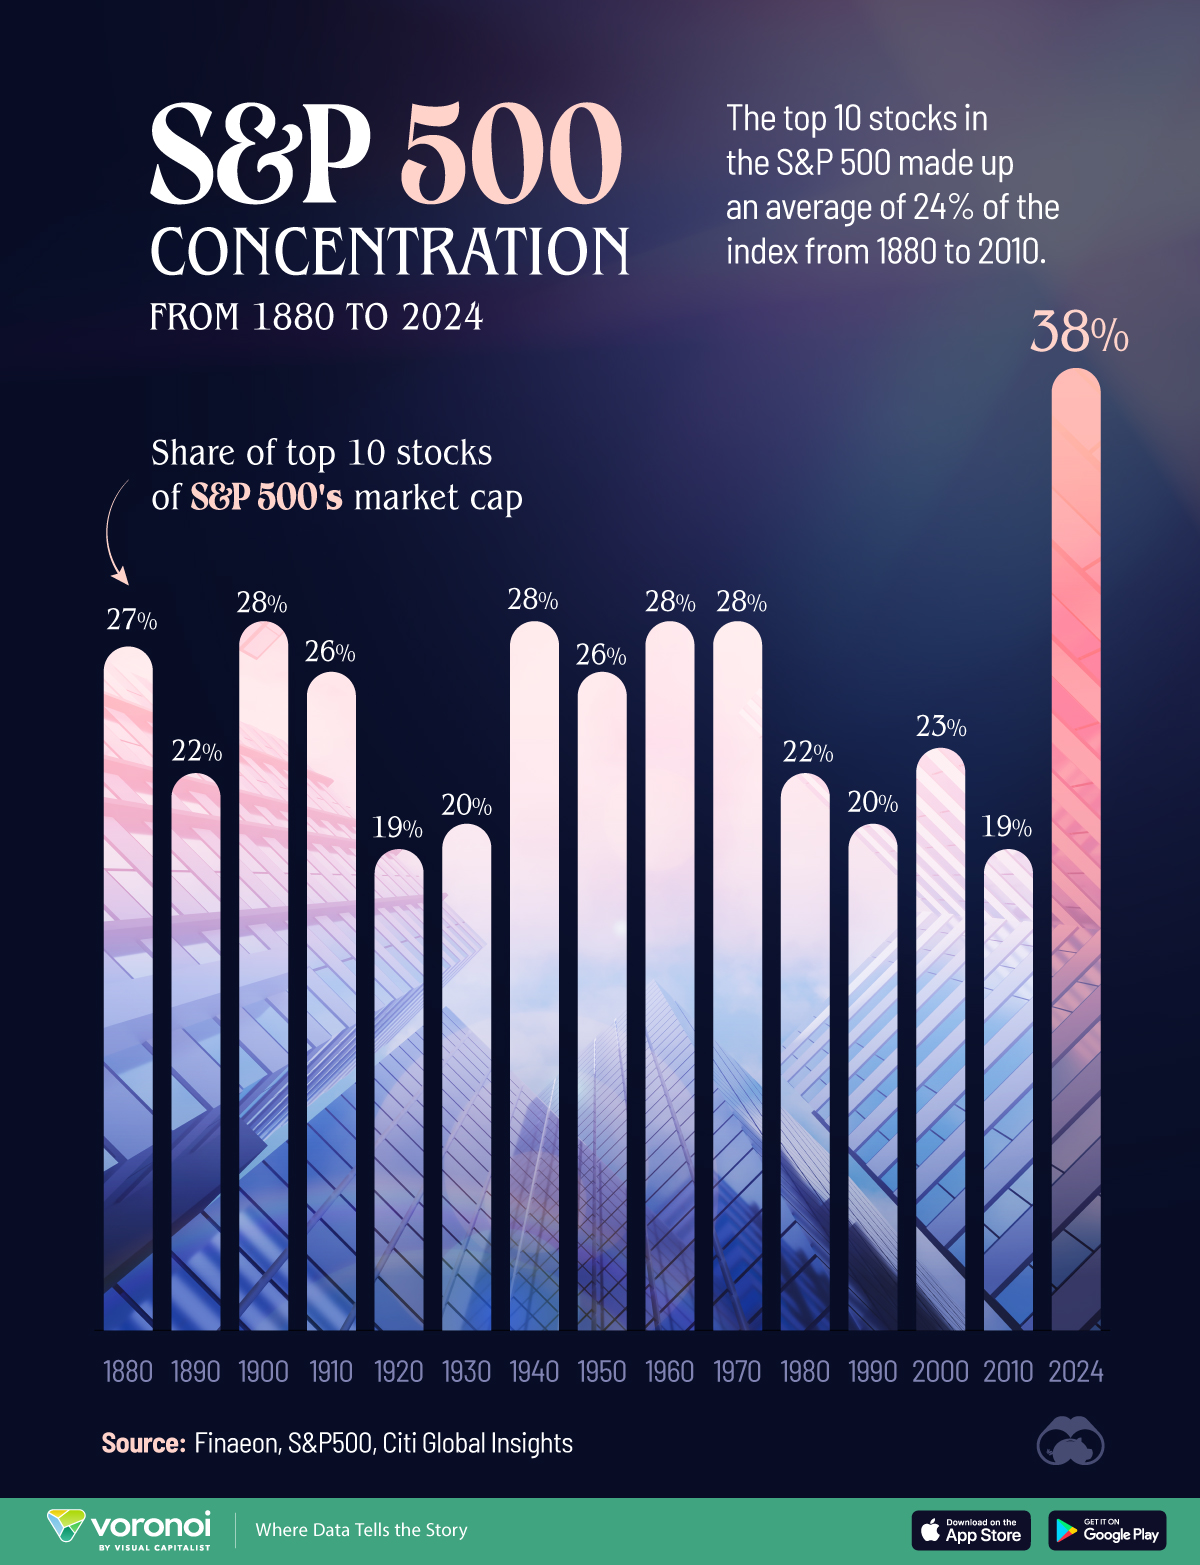
This graphic visualizes the share of the top 10 stocks in the S&P 500’s total market capitalization over time, from 1880 to 2024.
The data comes from Finaeon, S&P500, and Citi Global Insights.
The S&P 500 is Becoming More Concentrated
Below, we show the share of the top 10 stocks in the S&P 500’s total market cap, from 1880 to 2024.
| Year | Share of top 10 stocks of S&P 500's market cap |
|---|---|
| 1880 | 27% |
| 1890 | 22% |
| 1900 | 28% |
| 1910 | 26% |
| 1920 | 19% |
| 1930 | 20% |
| 1940 | 28% |
| 1950 | 26% |
| 1960 | 28% |
| 1970 | 28% |
| 1980 | 22% |
| 1990 | 20% |
| 2000 | 23% |
| 2010 | 19% |
| 2024 | 38% |
The top 10 stocks of the S&P 500 have typically made up a sizable portion of the index’s total market cap. Between 1880 and 2010, the top 10 stocks comprised an average of about one-quarter (24%) of the index from 1880 to 2010.
Recently, that number has shot up. Between 2010 to 2024, their share of the S&P 500’s market cap doubled from 19% to 38%.
As of early 2025, the top 10 stocks of the S&P 500 are mostly tech companies, including Apple, Microsoft, Nvidia, Amazon, Alphabet, Meta, Tesla, and Broadcom.
A highly concentrated index can introduce new risks of increased volatility and higher potential losses for investors if its major companies face downturns.
However, comparing U.S markets to other global equity markets reveals that the U.S. is far from the most concentrated market.
According to a Morgan Stanley report, the U.S. market was actually the fourth-least concentrated in 2023, with the top 10 stocks accounting for 30% of the national market cap that year.
In comparison, Switzerland and France’s top 10 stocks made up over 50% of their respective countries’ market caps.
Learn More on the Voronoi App ![]()
To learn more about the U.S.’ top-performing stocks, check out this graphic that visualizes the share of the S&P 500 market capitalization accounted for by the Magnificent Seven stocks over the last decade.
The post Charted: S&P 500 Market Concentration Over 145 Years appeared first on Visual Capitalist.