![]()
See this visualization first on the Voronoi app.

The Surging Value of the Magnificent Seven (2000-2024)
This was originally posted on our Voronoi app. Download the app for free on iOS or Android and discover incredible data-driven charts from a variety of trusted sources.
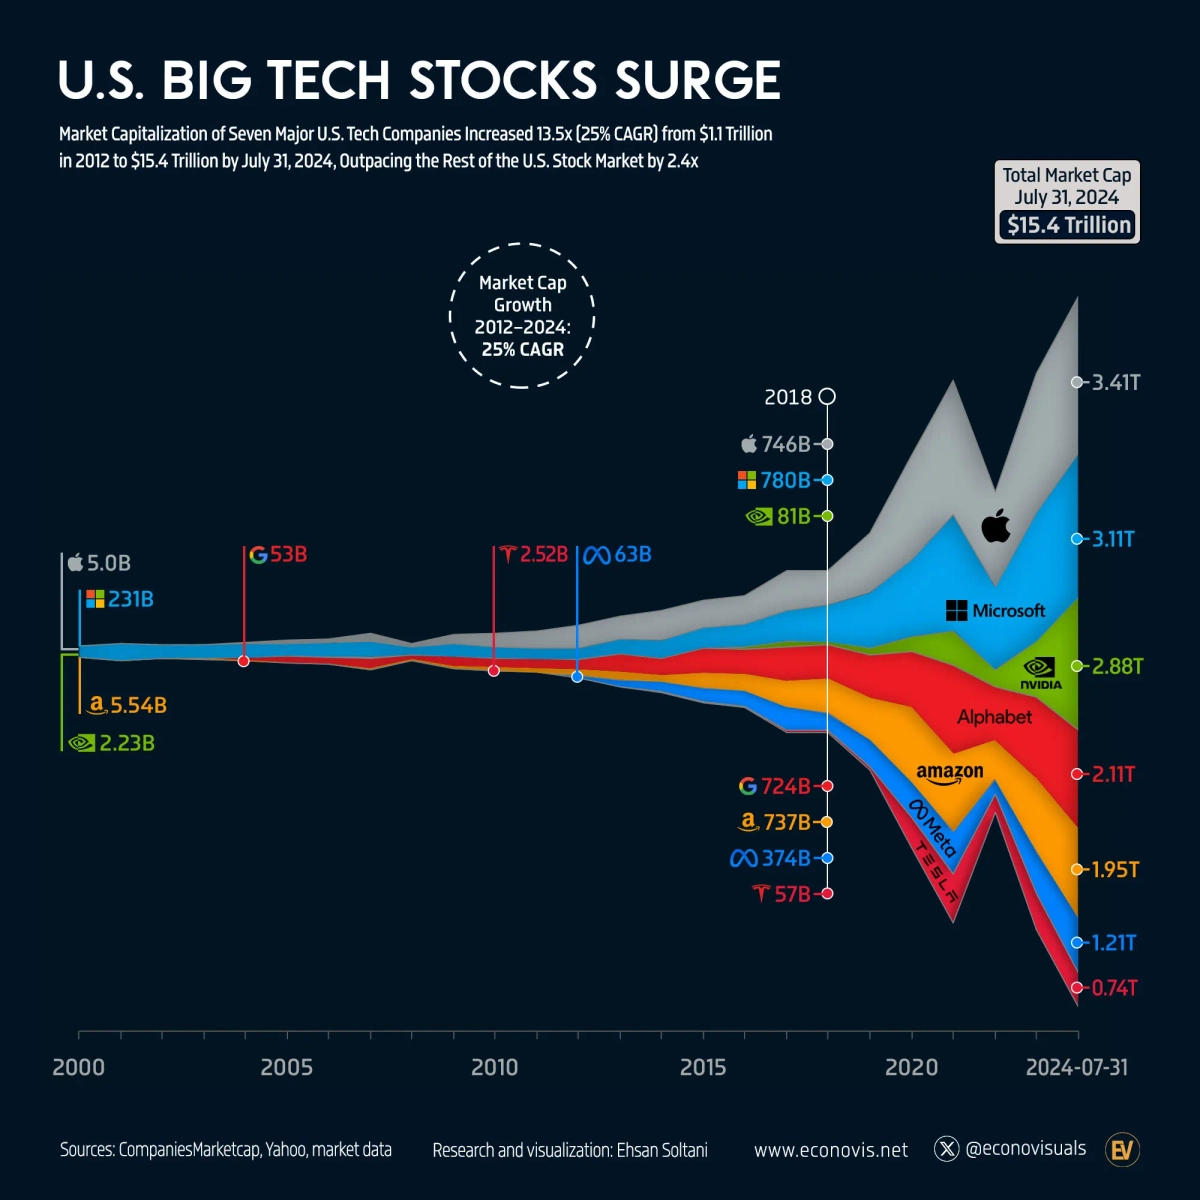
The Magnificent Seven are some of the largest companies in the U.S. stock market today, but things looked quite different back in 2000.
At that time, Apple, Microsoft, Amazon, and Nvidia had a combined value of just $244 billion. Alphabet (Google) was still a private company, and Meta (Facebook) and Tesla weren’t even founded yet.
In this visualization, creator Ehsan Soltani looks at the market capitalization of these prominent technology companies over the last few decades using data from CompaniesMarketCap.com as well as Yahoo Finance.
Market Capitalization Over Time
As of July 2024, the Magnificent Seven companies are worth $15.4 trillion combined. The below table shows their market capitalization from 2000 to 2024 in billions of dollars.
| Year | Apple | Microsoft | Nvidia | Alphabet | Amazon | Meta | Tesla | Total |
|---|---|---|---|---|---|---|---|---|
| 2000 | 5 | 231 | 2 | - | 6 | - | - | 244 |
| 2001 | 8 | 358 | 6 | - | 4 | - | - | 376 |
| 2002 | 5 | 277 | 1 | - | 7 | - | - | 290 |
| 2003 | 8 | 295 | 3 | - | 21 | - | - | 327 |
| 2004 | 26 | 291 | 4 | 53 | 18 | - | - | 392 |
| 2005 | 61 | 272 | 6 | 123 | 20 | - | - | 481 |
| 2006 | 73 | 292 | 13 | 141 | 16 | - | - | 536 |
| 2007 | 174 | 332 | 19 | 217 | 39 | - | - | 780 |
| 2008 | 76 | 173 | 4 | 97 | 22 | - | - | 372 |
| 2009 | 191 | 269 | 10 | 197 | 60 | - | - | 727 |
| 2010 | 297 | 235 | 9 | 190 | 81 | - | 3 | 814 |
| 2011 | 378 | 218 | 8 | 209 | 79 | - | 3 | 895 |
| 2012 | 500 | 224 | 8 | 232 | 114 | 63 | 4 | 1,143 |
| 2013 | 501 | 311 | 9 | 375 | 183 | 139 | 19 | 1,536 |
| 2014 | 643 | 382 | 11 | 360 | 144 | 217 | 28 | 1,784 |
| 2015 | 584 | 440 | 18 | 528 | 318 | 297 | 32 | 2,216 |
| 2016 | 609 | 483 | 58 | 539 | 356 | 332 | 34 | 2,411 |
| 2017 | 861 | 660 | 117 | 729 | 564 | 513 | 52 | 3,496 |
| 2018 | 746 | 780 | 81 | 724 | 737 | 374 | 57 | 3,500 |
| 2019 | 1,287 | 1,200 | 144 | 921 | 920 | 585 | 76 | 5,133 |
| 2020 | 2,255 | 1,681 | 323 | 1,185 | 1,634 | 778 | 669 | 8,525 |
| 2021 | 2,901 | 2,522 | 735 | 1,917 | 1,691 | 922 | 1,061 | 11,749 |
| 2022 | 2,066 | 1,787 | 364 | 1,145 | 857 | 320 | 389 | 6,928 |
| 2023 | 2,994 | 2,794 | 1,223 | 1,756 | 1,570 | 910 | 790 | 12,037 |
| 2024 | 3,405 | 3,109 | 2,878 | 2,111 | 1,945 | 1,211 | 741 | 15,400 |
Source: CompaniesMarketCap.com, Yahoo Finance. 2024 data is as of July 31, 2024.
Since 2012, the first year all seven companies were public, the Magnificent Seven has grown 13.5 times larger. Nvidia has seen the highest relative growth, with its market cap jumping 360 times larger over the same time frame. Nvidia’s size is especially impressive when you compare its market cap to other chipmakers.
At the other end of the scale, Apple’s market cap has only grown seven times higher since 2012. This smaller relative jump is because Apple was already worth $500 billion by the end of 2012, while Nvidia was only worth $8 billion at the time.
Recent Performance
Fast forward to 2024, and the Magnificent Seven companies are major players in the U.S. stock market. They drove 49% of the S&P 500’s total gains in the first half of 2024.
However, their performance has taken a downturn in recent weeks amid recession fears and concerns about overspending on AI. On top of this, Warren Buffett’s company Berkshire Hathaway sold half of its stake in Apple, and reporters said Nvidia’s newest AI processor could be delayed due to production issues.
Some market analysts have argued that the recent dip indicates a potential buying opportunity, since the Magnificent Seven companies are now at lower valuations.
The post Charted: The Surging Value of the Magnificent Seven (2000-2024) appeared first on Visual Capitalist.