![]()
See this visualization first on the Voronoi app.
Trade’s Diminishing Role in China’s Economy
This was originally posted on our Voronoi app. Download the app for free on iOS or Android and discover more data-driven charts from trusted sources.
Key Takeaways
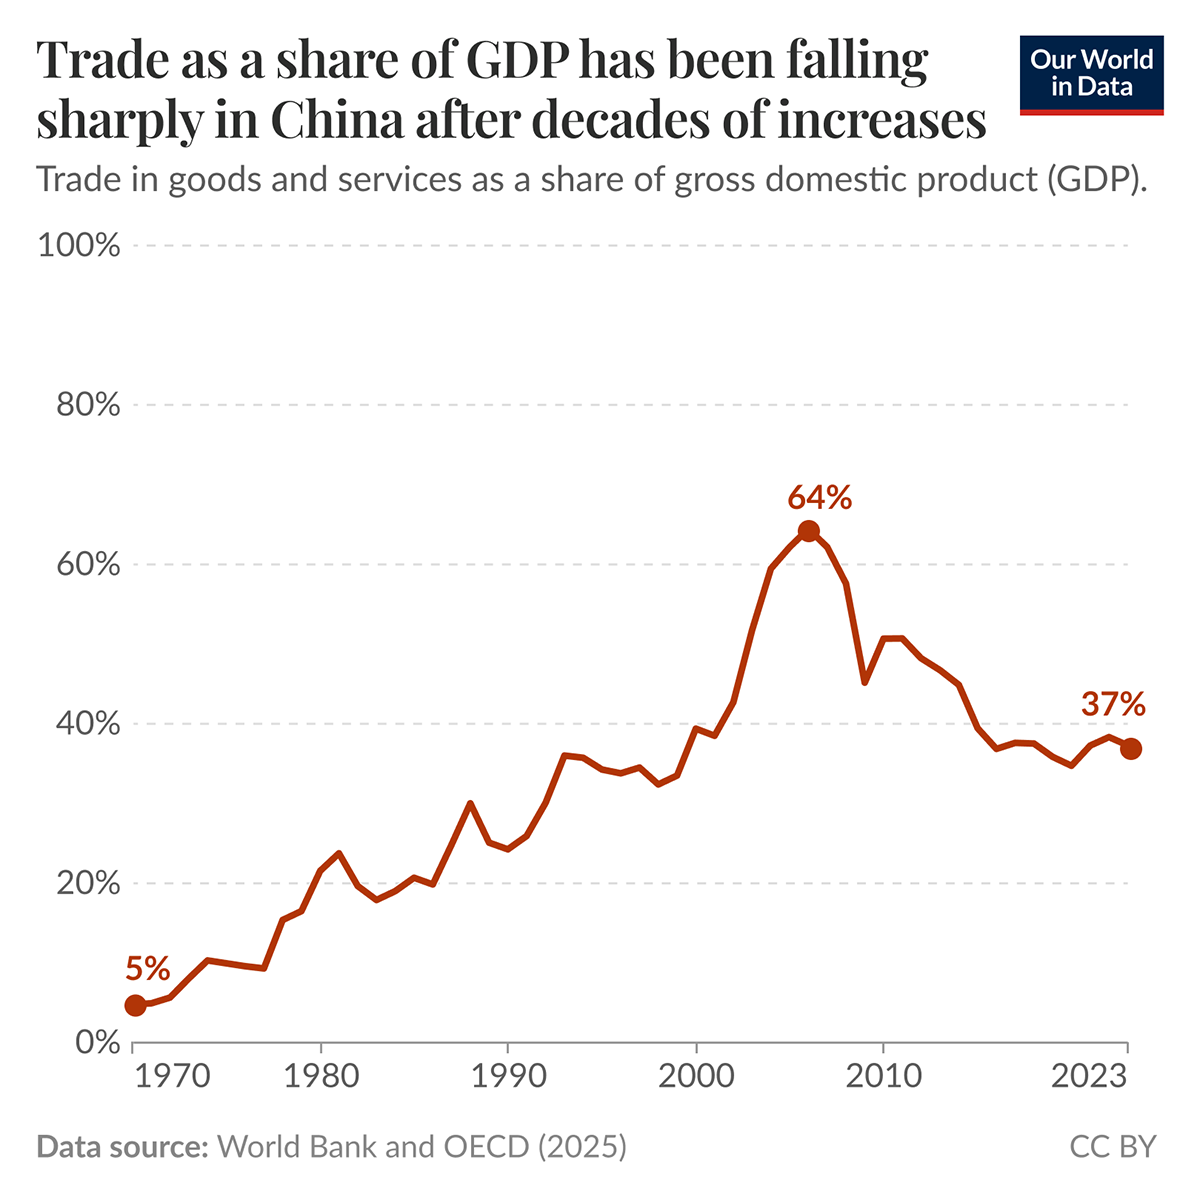
- China’s trade-to-GDP ratio peaked at 64% in 2006 but has dropped to 37.2% in 2024, its lowest level in two decades.
- The decline reflects faster growth in China’s domestic economy than in its external trade. Consumption and services are leading this growth.
- This shift represents a fundamental transformation from export-led growth to a more domestically-driven economic model.
China’s accession to the World Trade Organization (WTO) in 2001 turbo-charged factory output and exports, driving the trade share to its 2006 peak.
Foreign investment poured in, and multinational supply chains centered on the Pearl River and Yangtze River deltas. At that point, nearly two-thirds of Chinese economic activity was tied to cross-border trade.
As the chart above, by Our World in Data, shows, the 2006 peak represented the culmination of China’s integration into global value chains. At this stage, China served as the world’s manufacturing hub, importing raw materials and components for assembly and re-export.
From “Workshop of the World” to Consumer-Driven Giant
The table below shows this rise and subsequent decline.
| Year | China - Trade as a % of GDP |
|---|---|
| 1960 | 6.3 |
| 1965 | 5.9 |
| 1970 | 4.8 |
| 1975 | 10.0 |
| 1980 | 21.6 |
| 1985 | 20.7 |
| 1990 | 24.3 |
| 1995 | 34.3 |
| 2000 | 39.4 |
| 2005 | 62.2 |
| 2010 | 50.7 |
| 2015 | 39.5 |
| 2020 | 34.8 |
| 2023 | 37.3 |
Why China’s Trade Share Is Falling
Since the Global Financial Crisis of 2008, several forces have reduced China’s trade intensity:
Rapid domestic growth: Services and household consumption have outpaced exports, diluting trade’s weight in GDP. China’s economy has grown substantially in absolute terms, while trade growth has been more modest.
Policy rebalancing: Beijing’s “dual-circulation” strategy, introduced in recent years, explicitly encourages companies to serve domestic markets alongside international ones, reducing dependence on exports.
Geopolitical frictions: U.S. tariffs beginning in 2018, technology restrictions, and a global push for supply-chain diversification have moderated export momentum and encouraged trade restructuring.
Rising wages and industrial upgrading: As China moves up the value chain and labor costs increase, some labor-intensive production has shifted to lower-cost neighbors in Southeast Asia and other regions.
Structural economic transformation: China’s economy has become more service-oriented and consumption-driven, sectors that are inherently less trade-intensive than manufacturing.
Looking Ahead
From a peak of 64% in 2006, China’s trade-to-GDP ratio declined to an average of 33% between 2016 and 2024. Even at the current level of approximately 37%, trade remains a critical pillar of China’s economy—higher than the United States (~30%) but far below trade-dependent economies like Germany (~80%) or smaller export-oriented nations.
The trajectory of China’s trade openness will depend on several factors:
- The success of domestic market development and consumption growth
- Global demand patterns and international trade relations
- The evolution of U.S.-China economic relations
- China’s progress in moving up the value chain in high-tech industries
- Regional trade integration, particularly through initiatives like the Regional Comprehensive Economic Partnership (RCEP)
This transformation reflects China’s economic maturation from a developing manufacturing hub to a more balanced economy with significant domestic demand, marking one of the most significant structural shifts in the global economy over the past two decades.