China’s Growing Trade Dominance in Latin America
Over the past 20 years, China’s economic presence around the world has grown significantly, including in Latin America.
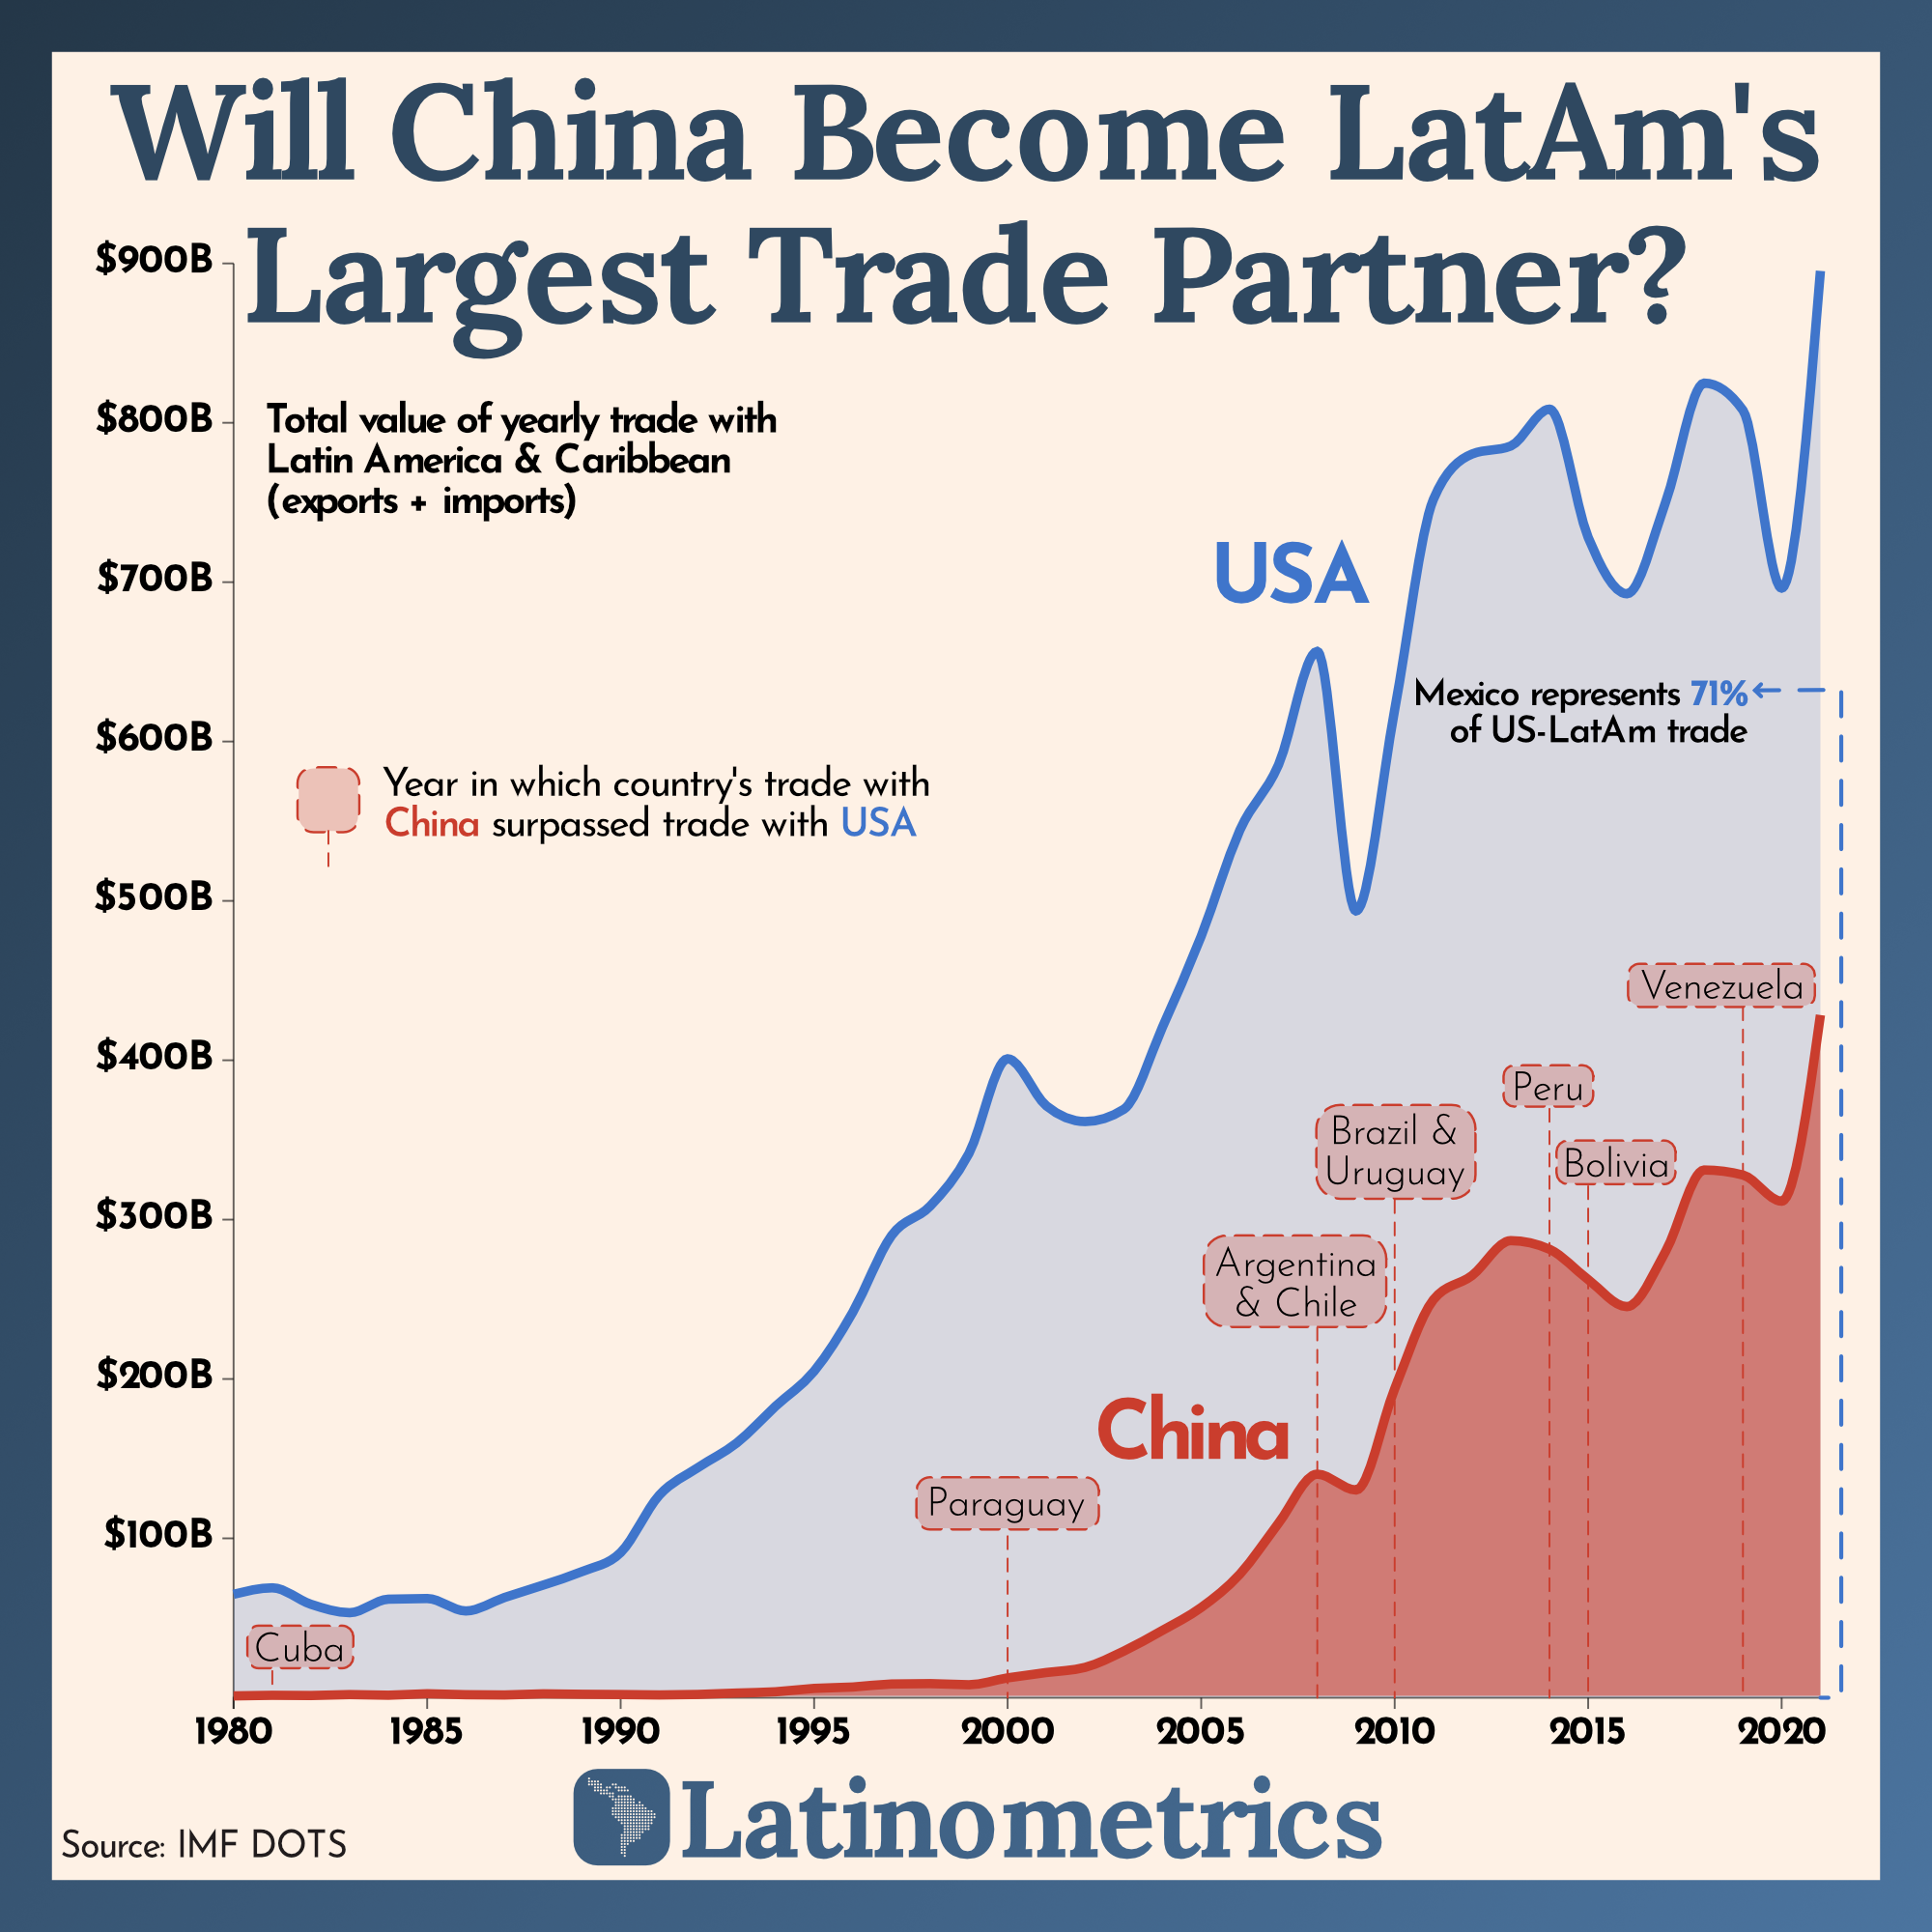
Now, China is one of Latin America’s largest trade partners, which is threatening U.S. dominance in the region. This graphic by Latinometrics uses IMF data to show trade flows between China and Latin America since the 1980s.
Two Decades of Trade Growth
Four decades ago, the United States had a much stronger trade relationship with Latin America than China did. In 1981, Cuba was the only Latin American country trading more with China than the United States.
Here’s a look at total trade flows between Latin America and the two countries since 1980. Latinometrics calculated trade flows as total exports plus imports.
| Trade Flows by Year | U.S. & Latin America | China & Latin America |
|---|---|---|
| 1980 | $64,916.46M | $1,149.20M |
| 1981 | $68,954.16M | $1,524.78M |
| 1982 | $58,601.14M | $1,381.61M |
| 1983 | $53,347.45M | $1,973.34M |
| 1984 | $61,829.84M | $1,573.58M |
| 1985 | $62,241.61M | $2,489.73M |
| 1986 | $54,441.85M | $1,888.88M |
| 1987 | $62,890.00M | $1,721.23M |
| 1988 | $70,673.07M | $2,433.94M |
| 1989 | $79,140.76M | $2,149.71M |
| 1990 | $91,090.09M | $1,997.48M |
| 1991 | $127,120.71M | $1,741.68M |
| 1992 | $144,422.66M | $2,051.77M |
| 1993 | $159,873.67M | $2,923.49M |
| 1994 | $182,872.71M | $3,724.97M |
| 1995 | $204,901.92M | $5,847.65M |
| 1996 | $241,927.58M | $6,711.47M |
| 1997 | $290,032.40M | $8,609.87M |
| 1998 | $308,555.72M | $8,844.21M |
| 1999 | $341,504.58M | $8,138.22M |
| 2000 | $400,901.25M | $12,452.97M |
| 2001 | $371,377.08M | $15,818.76M |
| 2002 | $361,536.31M | $19,033.47M |
| 2003 | $369,218.54M | $29,215.64M |
| 2004 | $420,744.88M | $42,242.20M |
| 2005 | $477,850.02M | $56,609.70M |
| 2006 | $544,418.91M | $77,528.04M |
| 2007 | $585,446.96M | $109,558.66M |
| 2008 | $656,499.37M | $140,274.87M |
| 2009 | $493,741.65M | $130,359.64M |
| 2010 | $619,989.84M | $193,853.31M |
| 2011 | $751,891.79M | $249,708.91M |
| 2012 | $780,401.27M | $264,908.73M |
| 2013 | $785,444.16M | $286,816.10M |
| 2014 | $808,542.96M | $281,412.70M |
| 2015 | $728,071.40M | $262,383.97M |
| 2016 | $692,719.56M | $245,403.45M |
| 2017 | $750,289.25M | $280,072.19M |
| 2018 | $824,877.82M | $331,131.25M |
| 2019 | $807,868.87M | $327,999.75M |
| 2020 | $696,294.90M | $311,584.87M |
| 2021 | $895,309.53M | $428,384.92M |
Things stayed relatively stagnant until the early 2000s. Then suddenly, at the start of the new millennium, trade between China and Latin America started to ramp up.
This uptick was driven largely by Chinese demand for things like copper, oil, and other raw materials that the country needed to help fuel its industrial revolution.
Momentum has continued for two decades, and now China is the top trading partner in nine different Latin American countries. In fact, in 2021, imports and exports between China and Latin America (excluding Mexico) reached $247 billion—that’s $73 billion more than trade flows with the United States that same year.
Trade between China and Latin America is expected to keep growing, at least for the time being. By 2035, trade flows between the two regions are projected to more than double, according to World Economic Forum.
China’s Global Economic Presence
China’s trade takeover of Latin America speaks to a wider trend that’s happening on a global scale—over the last two decades, China has surpassed the U.S. as the world’s largest trading partner.
While China is likely to remain the world’s leading trade partner for the foreseeable future, growth is likely to slow in the short-term, given ongoing supply chain issues and geopolitical tensions that have disrupted the global economy.
The post China’s Growing Trade Dominance in Latin America appeared first on Visual Capitalist.