
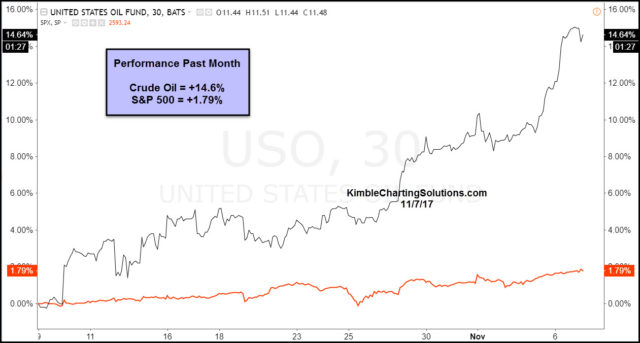
Crude Oil has been strong of late. Did you realize that Crude Oil has gained more in the past month than the S&P 500 has this year, see chart below.
CLICK ON CHART TO ENLARGE
The strong rally of late has Crude testing what appears to be a very important level in the chart below-
CLICK ON CHART TO ENLARGE
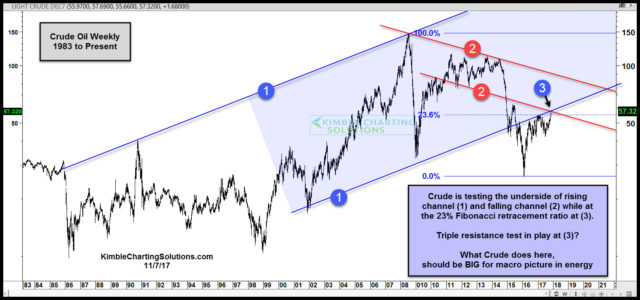
The strong rally of late has Crude testing the underside of rising channel (1) and falling channel (2), while testing the 23% Fibonacci retracement level of the 2008 highs/2016 lows at (3).
At this time “this is a resistance test for Crude.” What Crude does at (3), should send important short and long-term messages to Crude and the energy sector.
Crude traders have established a crowded trade, which is very similar to the positioning they had at the 2014 highs. The Power of the Pattern is of the opinion, this is a very important price test for this important global asset.
Why you see chart pattern analysis with brief commentary: There is a ton of news and opinions about markets and stocks that make the decision-making process more difficult than it needs to be.
I believe the Power of the chart Pattern provides all you need to see what is taking place in an asset and determine the action to take.
This approach has worked well for me and our clients and I encourage you to test it for yourself.
Receive my free research posted on the blog daily here
Or, send an email if you would like to see sample research and take me up on a trial of my premium or weekly research where I provide actionable alerts on breakouts and reversals in broad market indices, sectors, commodities, the miners and select individual stocks
Email [email protected]
Call us Toll free 877-721-7217 international 714-941-9381
Website: KIMBLECHARTINGSOLUTIONS.COM
follow on Twitter
See our latest webinar