![]()
See this visualization first on the Voronoi app.
Use This Visualization
Global Debt Hits a New High of $315 Trillion
This was originally posted on our Voronoi app. Download the app for free on iOS or Android and discover incredible data-driven charts from a variety of trusted sources.
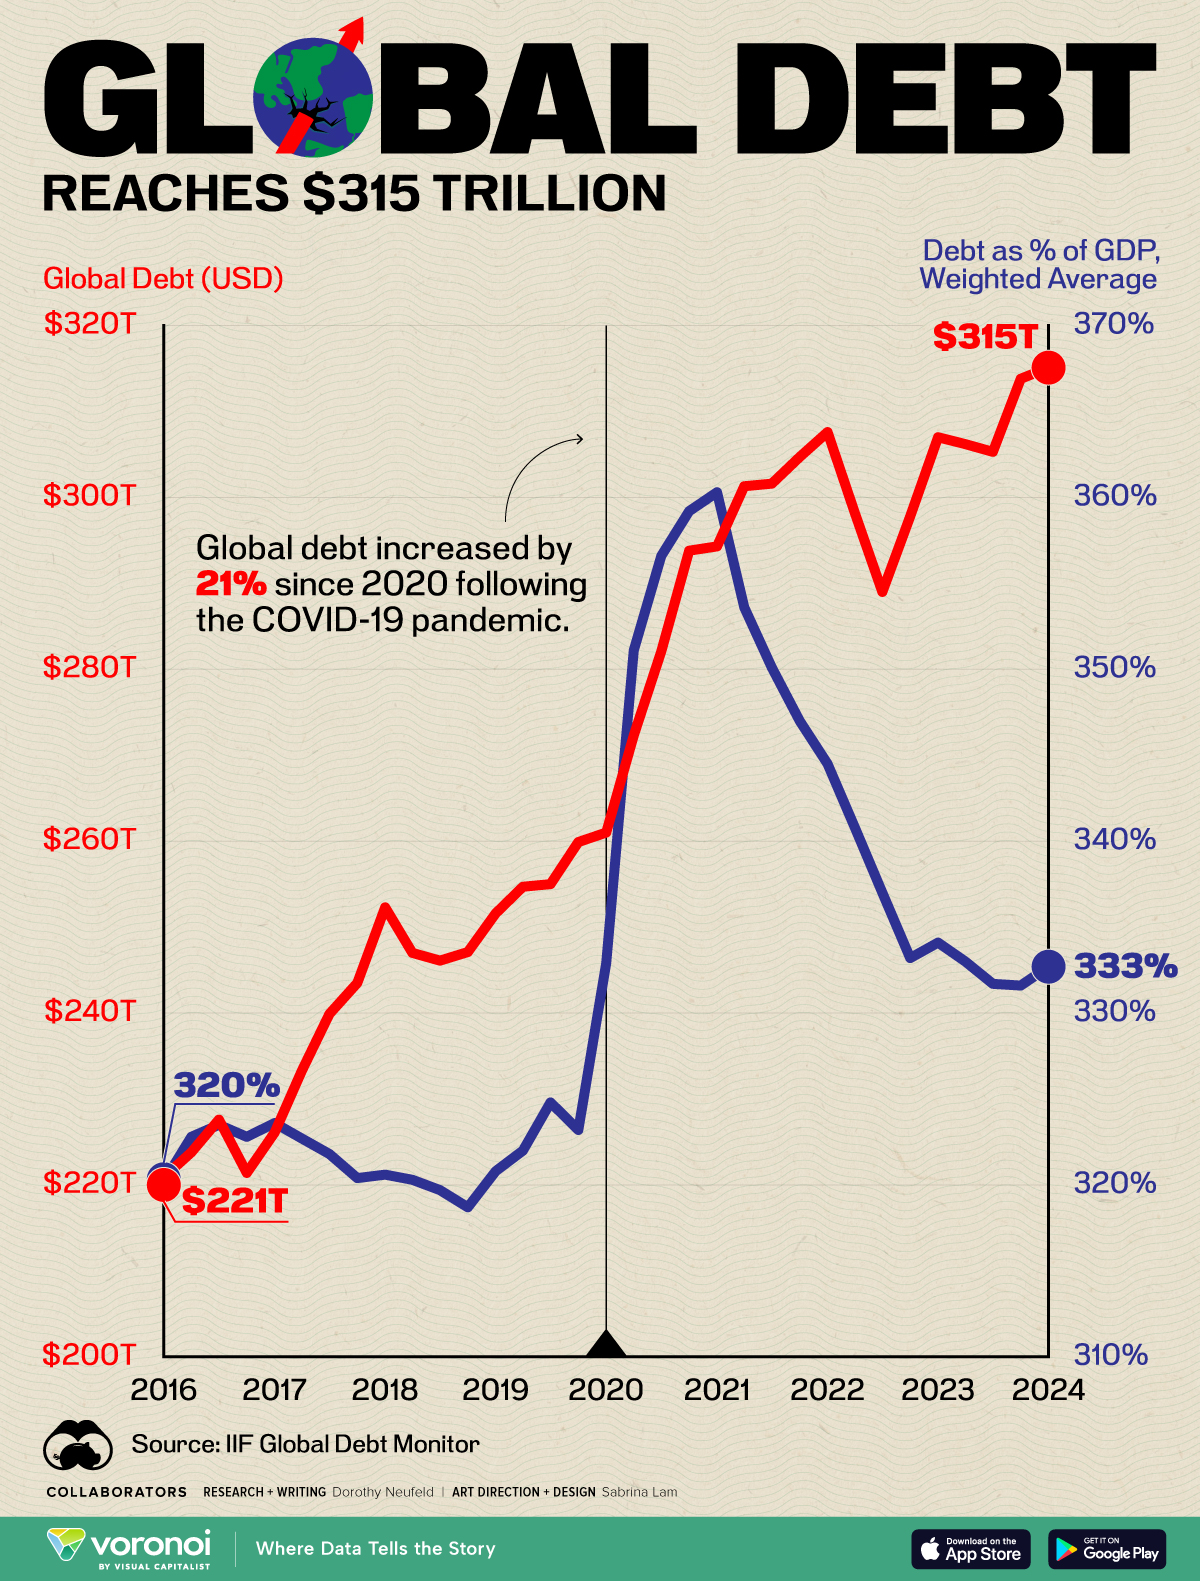
The global debt stock hit a new record in the first quarter of 2024, increasing by $1.3 trillion in just three months.
This deluge in borrowing is a widespread trend across economies. While the U.S. and Japan were the largest contributors across advanced economies, China, India, and Mexico drove the largest share in emerging markets. Overall, the global debt-to-GDP ratio reached 333% as higher debt servicing costs and growing debt burdens continue piling up.
This graphic shows the stock of global debt in 2024, based on data from the Institute of International Finance (IIF).
A Growing Mountain of Debt
Below, we show how global debt climbed to an all-time high of $315.1 trillion in the first quarter of 2024:
| Date | Global Debt (USD) | Debt as % of GDP, Weighted Average |
|---|---|---|
| 2024 Q1 | $315.1T | 332.7% |
| 2023 Q4 | $313.8T | 331.6% |
| 2023 Q3 | $305.3T | 331.7% |
| 2023 Q2 | $306.2T | 333.0% |
| 2023 Q1 | $307.0T | 334.1% |
| 2022 Q4 | $297.8T | 333.2% |
| 2022 Q3 | $289.0T | 337.0% |
| 2022 Q2 | $298.2T | 340.8% |
| 2022 Q1 | $307.6T | 344.5% |
| 2021 Q4 | $304.7T | 347.0% |
| 2021 Q3 | $301.6T | 350.1% |
| 2021 Q2 | $301.3T | 353.6% |
| 2021 Q1 | $294.3T | 360.3% |
| 2020 Q4 | $293.8T | 359.2% |
| 2020 Q3 | $282.1T | 356.6% |
| 2020 Q2 | $272.3T | 351.1% |
| 2020 Q1 | $261.0T | 332.9% |
| 2019 Q4 | $259.9T | 323.2% |
| 2019 Q3 | $255.0T | 324.8% |
| 2019 Q2 | $254.7T | 322.0% |
| 2019 Q1 | $251.6T | 320.8% |
| 2018 Q4 | $247.1T | 318.7% |
| 2018 Q3 | $246.1T | 319.7% |
| 2018 Q2 | $247.0T | 320.3% |
| 2018 Q1 | $252.3T | 320.6% |
| 2017 Q4 | $243.5T | 320.4% |
| 2017 Q3 | $239.9T | 321.8% |
| 2017 Q2 | $233.3T | 322.7% |
| 2017 Q1 | $226.1T | 323.6% |
| 2016 Q4 | $221.4T | 322.8% |
| 2016 Q3 | $227.6T | 323.5% |
| 2016 Q2 | $223.8T | 322.8% |
| 2016 Q1 | $220.9T | 320.2% |
Since the onset of the pandemic, debt has surged by 21%, adding $54.1 trillion to the global total.
Today, the largest share of debt is held by non-financial corporations, at $94.1 trillion, while government borrowings follow closely behind at $91.4 trillion. Meanwhile, the financial sector holds $70.4 trillion in debt and households carry $59.1 trillion.
While stimulus measures fueled an influx of borrowing, it is leaving many economies in a more precarious state. In America, debt servicing costs are now more than defense spending, and the interest bill is set to rise further. Consequently, the government may need to raise taxes or cut spending in order to tackle its debt. So far, neither political party has a meaningful strategy that addresses the country’s fiscal sustainability.
For emerging markets, increasing debt burdens present greater risks. These risks are especially acute if a country experiences sluggish growth during a high rate environment. In this scenario, many emerging markets may need to restructure their debt as borrowing becomes unaffordable.
Even more concerningly, about a third of emerging markets have not recovered from the pandemic, with per capita income standing beneath levels seen in 2019. Over the quarter, debt held by emerging markets hit a record $105 trillion, climbing by $55 trillion over the last 10 years.
The post Global Debt Hits a New High of $315 Trillion appeared first on Visual Capitalist.