![]()
See this visualization first on the Voronoi app.
Use This Visualization
Charted: How America’s Poverty Rates Differ by Race
This was originally posted on our Voronoi app. Download the app for free on iOS or Android and discover incredible data-driven charts from a variety of trusted sources.
The U.S. poverty rate stands at 12%, affecting about 41 million people across the country. At the state level, this rate ranges from 7% to 18%, depending on local economic conditions. But how does poverty differ when examined through the lens of racial demographics?
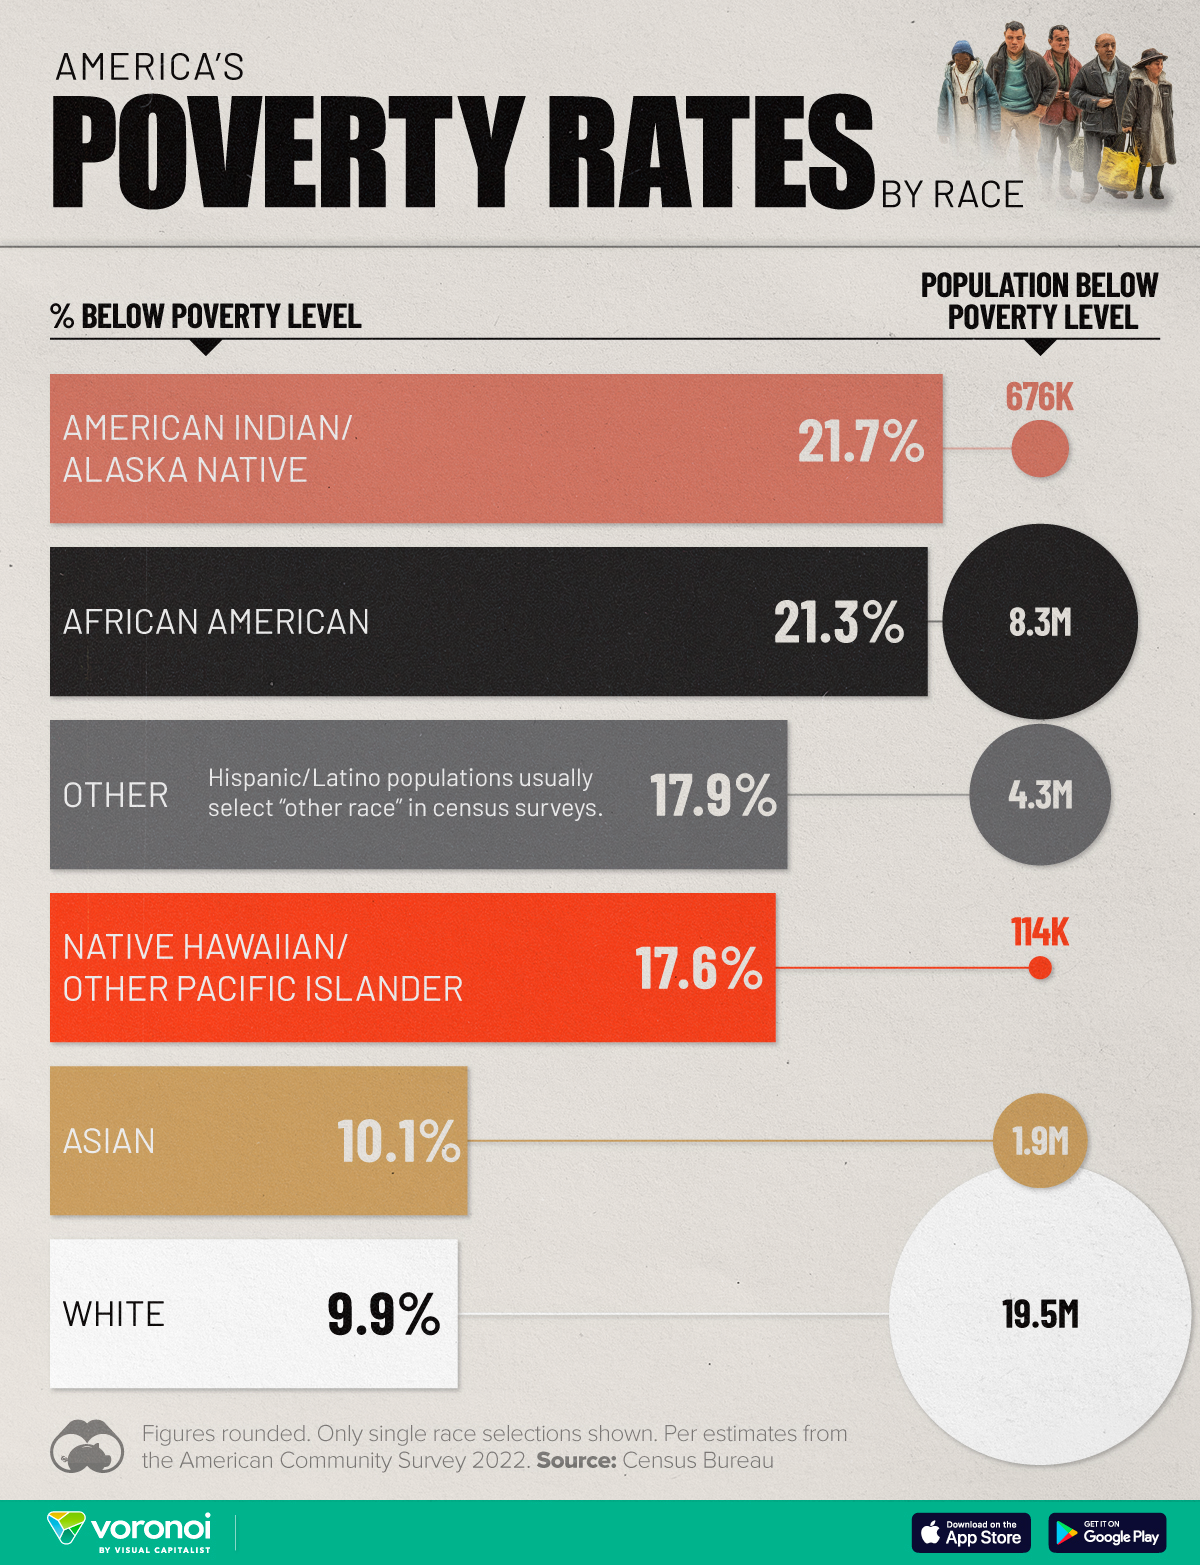
This chart visualizes the percentage and number of Americans living below the poverty threshold, categorized by race, based on data from the American Community Survey 2022 conducted by the Census Bureau. It focuses on respondents who selected a single race.
The Census Bureau sets poverty thresholds based on family size and composition. For families with incomes below these thresholds, every individual in the family is considered in poverty.
Racial Disparities in Poverty
The data reveals distinct differences in poverty rates among racial groups, reflecting the complex social and economic dynamics that have evolved over generations.
| Race | % Below Poverty Level | # Below Poverty Level |
|---|---|---|
| American Indian/Alaska Native | 21.7% | 675,913 |
| African American | 21.3% | 8,317,088 |
| Other* | 17.9% | 4,303,587 |
| Native Hawaiian/Other Pacific Islander | 17.6% | 113,693 |
| Asian | 10.1% | 1,937,553 |
| White | 9.9% | 19,544,155 |
*Hispanic/Latino populations usually select “other race” in census surveys. Figures rounded.
While poverty exists across all racial groups, there are some significant variations in both the rates and total numbers. These disparities reflect a combination of historical factors, structural inequalities, and ongoing challenges unique to different communities.
Native and Black Americans Face Higher Poverty Rates
Both Native Americans and Black Americans have the highest poverty rates, with about one in five individuals from these groups living below the poverty line. These groups are considered “overrepresented” in poverty statistics, meaning their share in poverty exceeds their proportion of the total U.S. population.
Long-standing issues have created cycles of poverty that, despite some progress, remain challenging to overcome in the face of ongoing systemic inequalities.
Other racial groups also grapple with poverty as well. There are 19.5 million white Americans below the poverty line. Although the rate is lower, about one-in-ten, the absolute number of people below the poverty threshold is the largest of all groups.
Learn More on the Voronoi App ![]()
The U.S. also falls behind its peers when it comes to government support to help socio-economic mobility. Check out Hours of Work Needed to Escape Poverty to see how it measures up against other high income economies.
The post How America’s Poverty Rates Differ by Race appeared first on Visual Capitalist.