Published
16 mins ago
on
June 11, 2024
| 15 views
-->
By
Julia Wendling
The following content is sponsored by The Hinrich Foundation
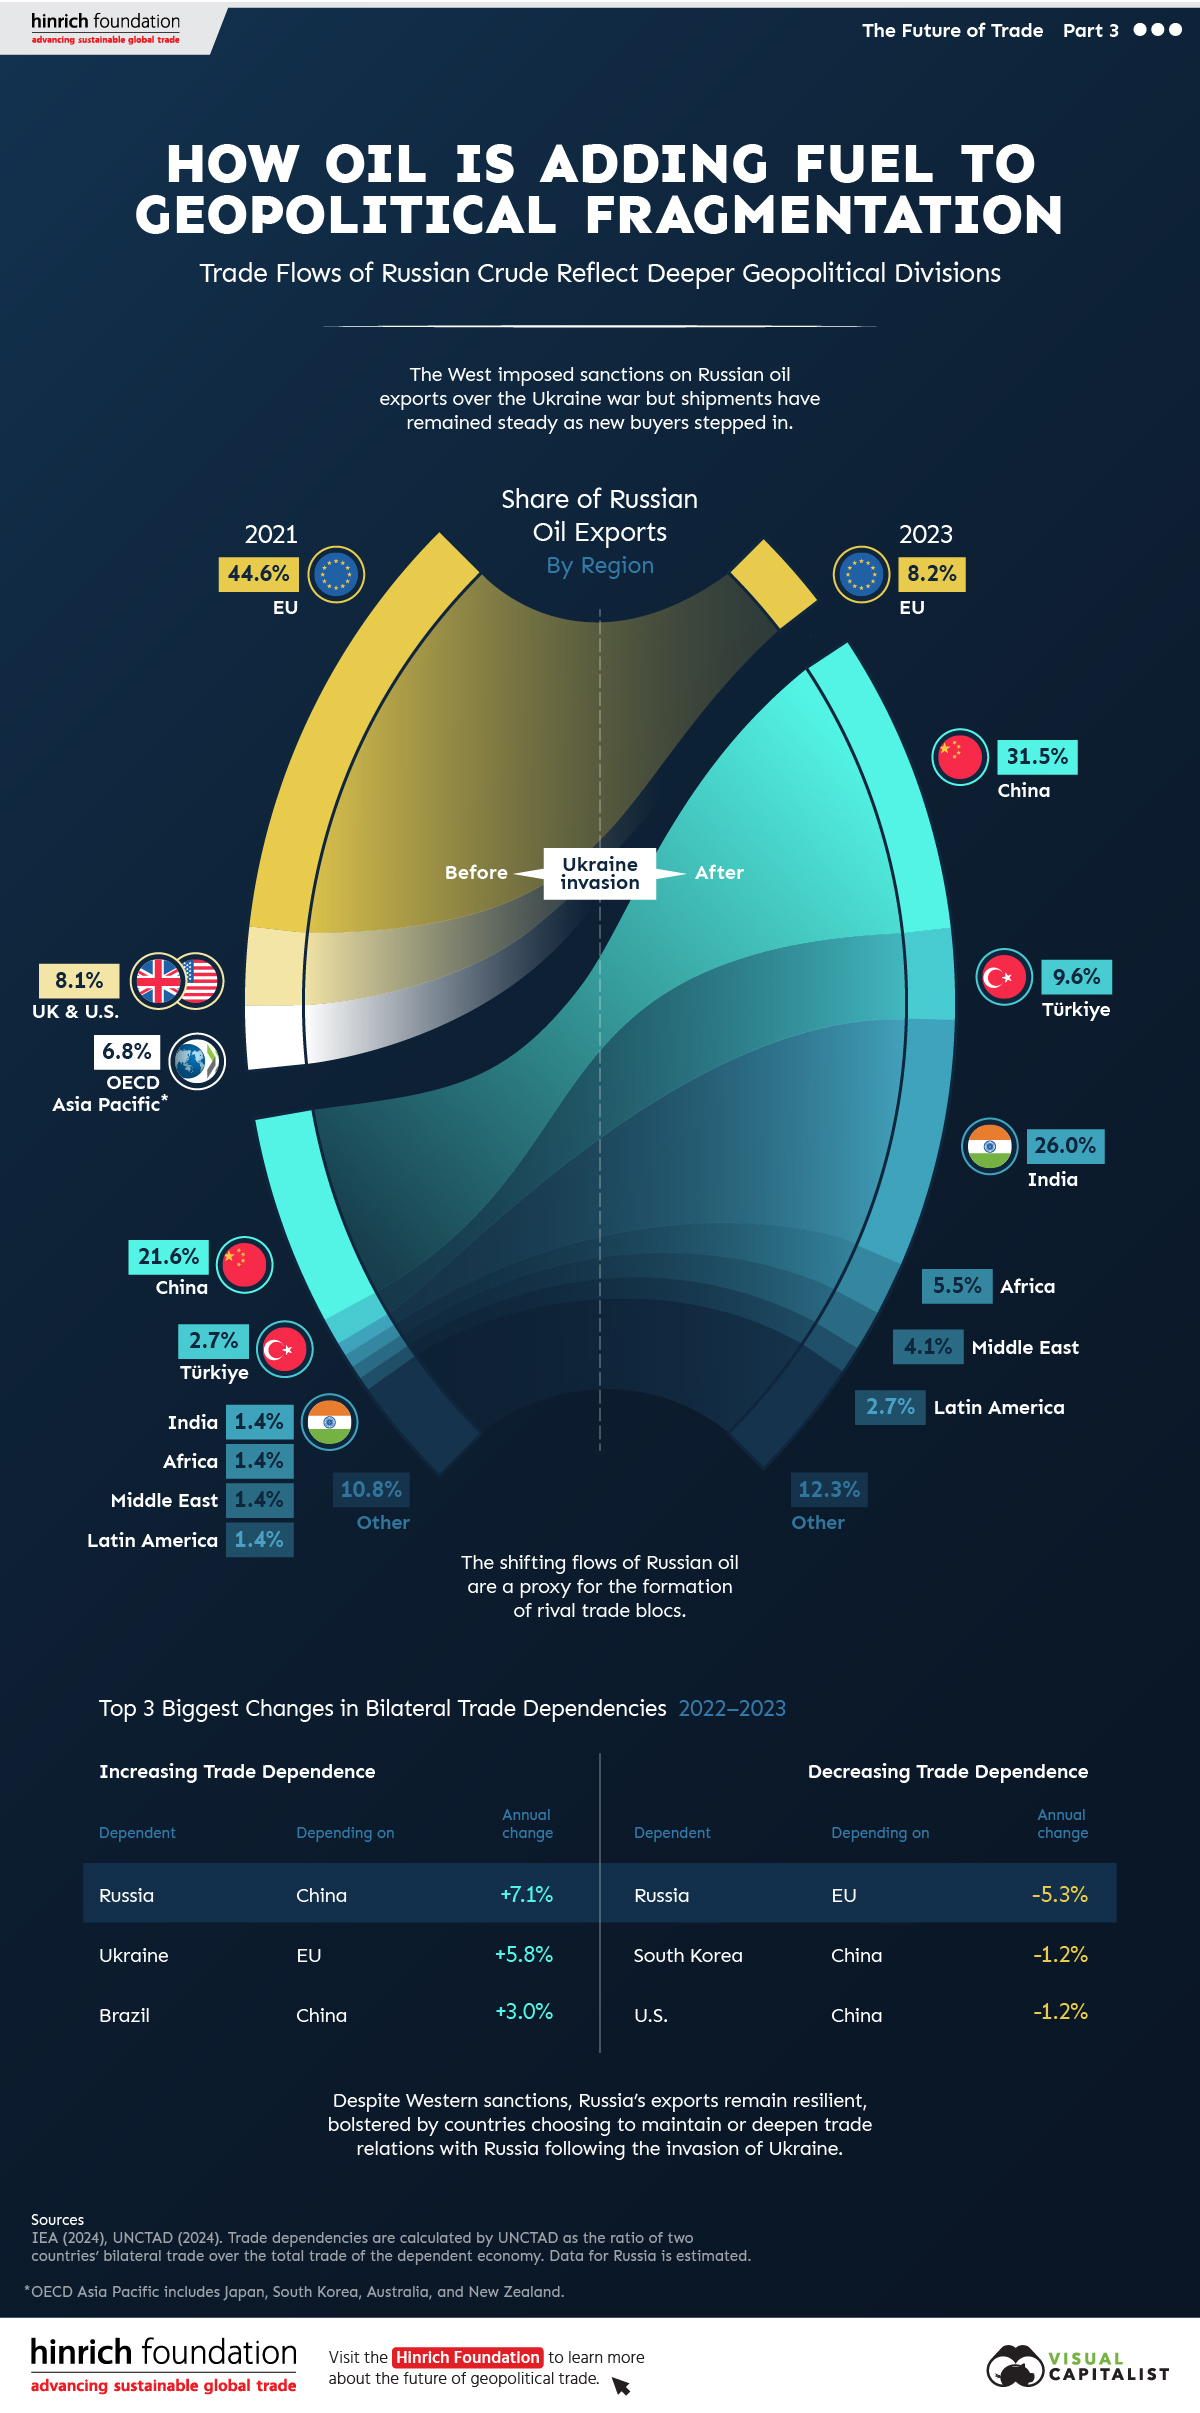
How Oil Is Adding Fuel to Global Fragmentation
Russia’s invasion of Ukraine in February 2022 led to severe bans or restrictions on Russian oil from the West. Meanwhile, other nations—including China, India, and Türkiye—opted to deepen trade ties with the country.
This graphic from the Hinrich Foundation is the final visualization in a three-part series covering the future of trade. It provides visual context to the growing divide among countries shunning Russian oil versus those taking advantage of the excess supply.
Which Countries Have Decreased or Banned Russian Oil Imports?
This analysis uses data from the IEA’s February 2024 Oil Market Report on Russian oil exports from 2021 to 2023.
Following the invasion, both the U.S. and the UK enacted a complete ban on Russian crude. Imports dropped from 600,000 barrels per day (bpd) in 2021 to zero by late-2022.
| Country/Region | 2021 (bpd) | 2022 (bpd) | 2023 (bpd) | Change; 2021-2023 (bpd) |
|---|---|---|---|---|
| EU | 3.3M | 3.0M | 600K | -2.7M |
| UK & U.S. | 600K | 100K | 0 | -600K |
| OECD Asia | 500K | 200K | 0 | -500K |
Similarly, the EU, which has historically been more reliant on oil from Russia, dropped imports by over 80%, from 3.3 million bpd in 2021 to 600,000 bpd in 2023.
OECD Asia-Pacific—which includes Japan, South Korea, Australia, and New Zealand—also slashed their Russian oil imports.
Which Countries Have Increased Imports of Russian Oil?
The pullback in demand for Russian crude from the West created a buying opportunity for countries and regions that chose not to support Western sanctions.
| Country/Region | 2021 (bpd) | 2022 (bpd) | 2023 (bpd) | Change; 2021-2023 (bpd) |
|---|---|---|---|---|
| India | 100K | 900K | 1.9M | +1.8M |
| China | 1.6M | 1.9M | 2.3M | +700K |
| Türkiye | 200K | 400K | 700K | +500K |
| Africa | 100K | 100K | 400K | +300K |
| Middle East | 100K | 200K | 300K | +200K |
| Latin America | 100K | 100K | 200K | +100K |
| Other | 800K | 600K | 900K | +100K |
India increased its imports of oil from Russia, by the largest amount from 2021 to 2023—up to 1.9 million bpd from only 100,000 bpd.
China, the biggest net importer, also saw a large uptick. The country boosted imports for Russian oil by over 40% over this timeframe. Türkiye increased imports of Russian crude by an additional 500,000 bpd.
Several other regions—such as Africa, the Middle East, and Latin America—saw slight upticks in imports.
Shifting Trade Dependencies
The dynamics present in the global crude market underscore broader trends in Russia’s trade relationships. Russia is becoming increasingly less economically reliant on the West and more reliant on China.
From 2022 to 2023, the largest upward shift in the UNCTAD’s bilateral trade dependency estimates was Russia’s increased reliance upon China (+7.1%).
| Dependent | Depending On | Annual Change |
|---|---|---|
| Russia | China | +7.1% |
| Ukraine | EU | +5.8% |
| Brazil | China | +3.0% |
Note: Trade dependencies are calculated by UNCTAD as the ratio of two countries’ bilateral trade over the total trade of the dependent economy.
In fact, China threw a lifeline to Russia in the aftermath of the Ukraine invasion. The Atlantic Council reported that Chinese exports to Russia have grown 121% since 2021, while exports to the rest of the world have increased by only 29% in the same period.
In contrast, Russia also exhibited a large decrease in reliance on the EU (-5.3%). South Korea and the U.S. have made shifts to further distance themselves from China as geopolitical tensions continue to mount.
| Dependent | Depending On | Annual Change |
|---|---|---|
| Russia | EU | -5.3% |
| South Korea | China | -1.2% |
| U.S. | China | -1.2% |
As the Russian oil market shows, geopolitical tensions have the potential to significantly impact trade. Though Russian crude exports remained steady amid the conflict, this necessitated a shift in its main trading partners.
![]()
Visit the Hinrich Foundation to learn more about the future of geopolitical trade

Please enable JavaScript in your browser to complete this form.Enjoying the data visualization above? *Subscribe
Related Topics: #china #oil #india #Russia #trade #crude #geopolitics #uk #iea #U.S. #Türkiye #Trade Dependencies
Click for Comments
var disqus_shortname = "visualcapitalist.disqus.com";
var disqus_title = "How Oil Is Adding Fuel to Geopolitical Fragmentation";
var disqus_url = "https://www.visualcapitalist.com/sp/hf03-how-oil-is-adding-fuel-to-global-fragmentation/";
var disqus_identifier = "visualcapitalist.disqus.com-167368";
You may also like
-
Stocks2 weeks ago
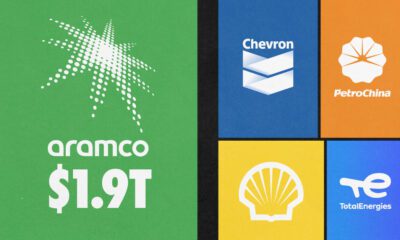
Comparing Saudi Aramco’s $1.9T Valuation to Its Rivals
See how much larger Saudi Aramco’s market cap is compared to rivals like Chevron, ExxonMobil, and Shell.
-
Energy7 months ago
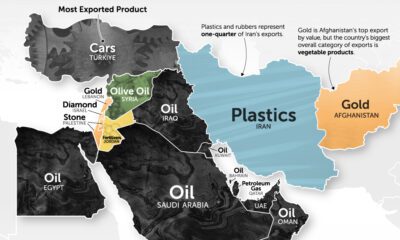
Mapped: The Top Middle East Exports by Country
It’s more than just oil. This map of Middle East exports shows the top global product of each country by value.
-
Countries9 months ago
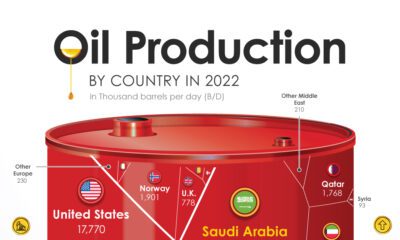
Charted: The World’s Biggest Oil Producers
Just three countries—the U.S., Saudi Arabia and Russia—make up the lion’s share of global oil supply. Here are the biggest oil producers in 2022.
-

Technology1 year ago
Prediction Consensus: What the Experts See Coming in 2023
Using our database of 500+ predictions from reports, articles, interviews, and more, we highlight what experts think will happen in 2023
-
Oil and Gas2 years ago
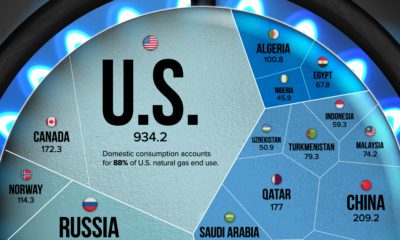
Which Countries Produce the Most Natural Gas?
Natural gas prices have risen since Russia’s invasion of Ukraine. This visualization highlights the world’s largest natural gas producers.
-
Oil and Gas2 years ago
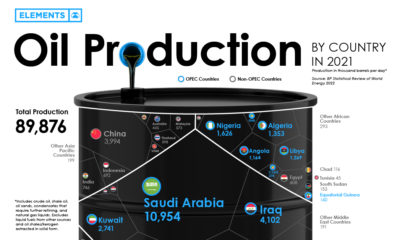
Visualizing the World’s Largest Oil Producers
Global oil production averaged 89.8 million barrels of oil per day in 2021. Here are the world’s largest oil producers.
Subscribe
Please enable JavaScript in your browser to complete this form.Join the 375,000+ subscribers who receive our daily email *Sign Up
The post How Oil Is Adding Fuel to Geopolitical Fragmentation appeared first on Visual Capitalist.