![]()
See this visualization first on the Voronoi app.
Use This Visualization
Mapped: Average Salary by State in 2025
This was originally posted on our Voronoi app. Download the app for free on iOS or Android and discover incredible data-driven charts from a variety of trusted sources.
While wages in the U.S. have grown in recent years, many families are still feeling the squeeze of high inflation. Pay levels vary widely not just by profession, but also by geography.
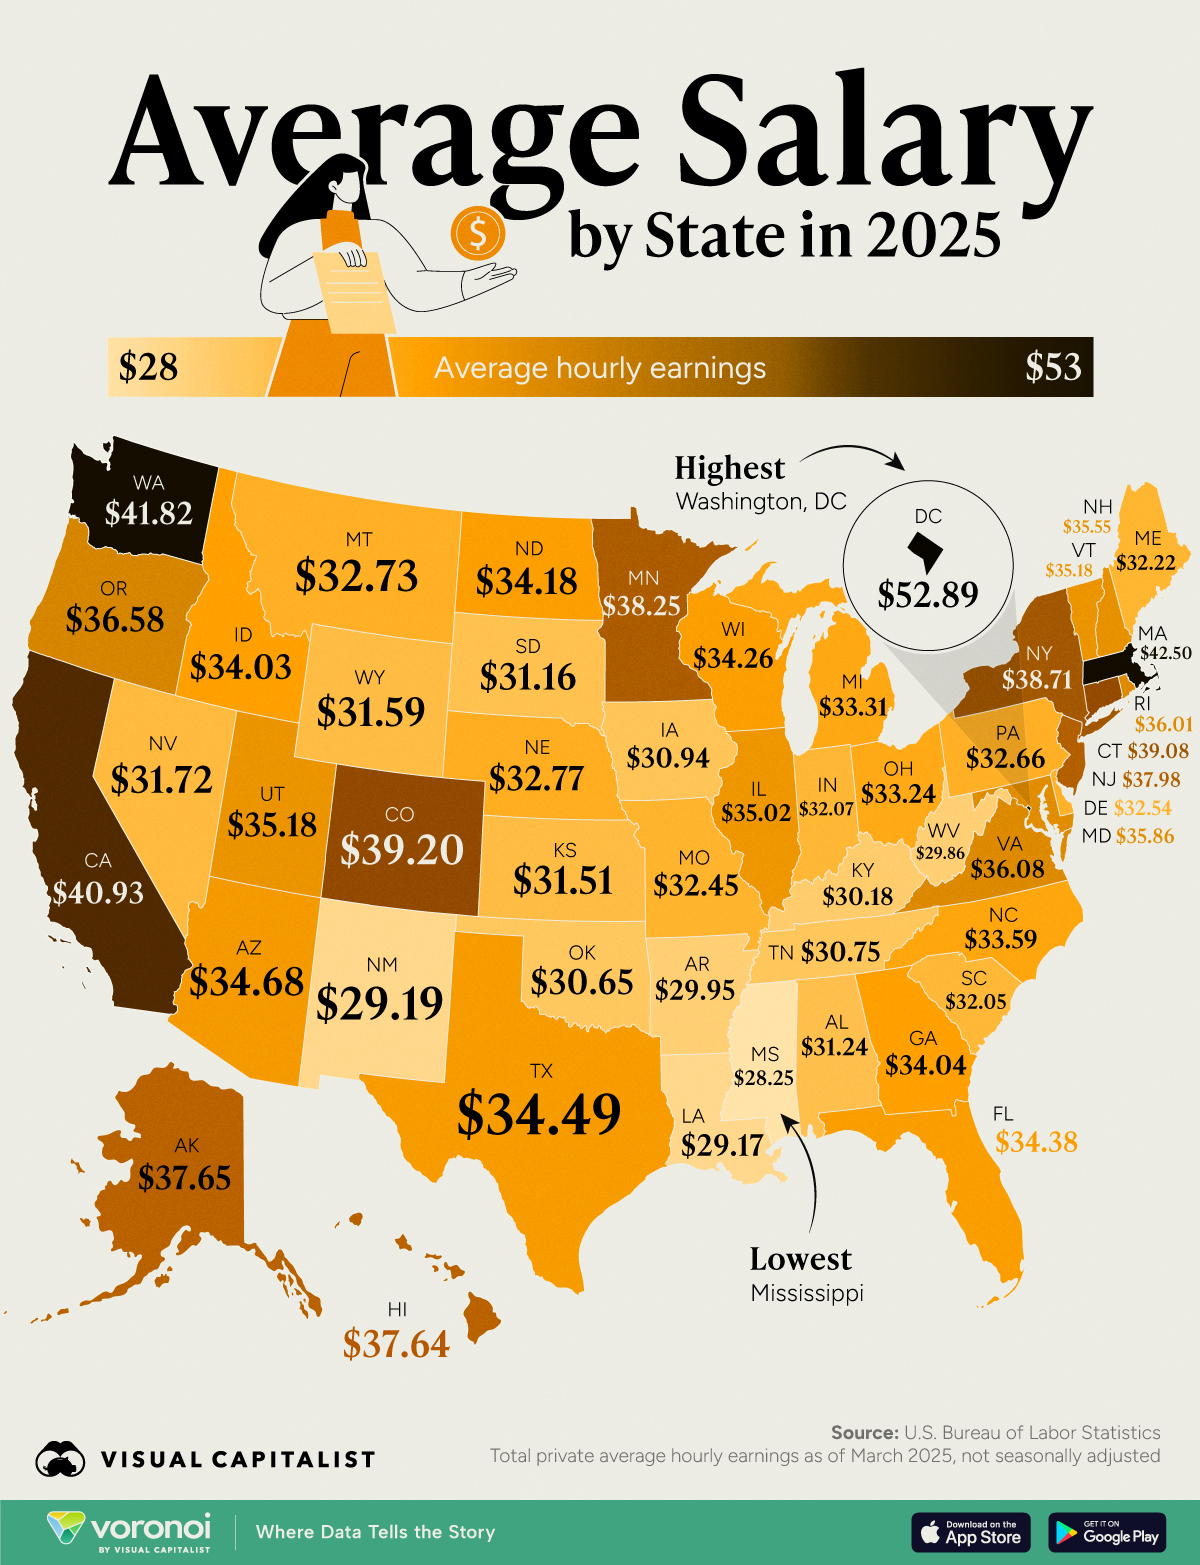
This graphic maps the average salary by U.S. state using the latest data from the Bureau of Labor Statistics, as of March 2025. The figures represent total private hourly earnings, not seasonally adjusted.
DC Tops the List
At the top of the list is Washington, DC, where workers earn an average of $52.89 per hour, far outpacing every state. This reflects the region’s concentration of high-paying jobs in government, law, and professional services.
Massachusetts comes in second at $42.50/hour, followed by Washington at $41.82, and California at $40.93. In common, these states are home to major tech, biotech, and finance hubs.
| State/District | Average hourly earnings |
|---|---|
| District of Columbia | $52.89 |
| Massachusetts | $42.50 |
| Washington | $41.82 |
| California | $40.93 |
| Colorado | $39.20 |
| Connecticut | $39.08 |
| New York | $38.71 |
| Minnesota | $38.25 |
| New Jersey | $37.98 |
| Alaska | $37.65 |
| Hawaii | $37.64 |
| Oregon | $36.58 |
| Virginia | $36.08 |
| Rhode Island | $36.01 |
| Maryland | $35.86 |
| New Hampshire | $35.55 |
| Utah | $35.18 |
| Vermont | $35.18 |
| Illinois | $35.02 |
| Arizona | $34.68 |
| Texas | $34.49 |
| Florida | $34.38 |
| Wisconsin | $34.26 |
| North Dakota | $34.18 |
| Georgia | $34.04 |
| Idaho | $34.03 |
| North Carolina | $33.59 |
| Michigan | $33.31 |
| Ohio | $33.24 |
| Nebraska | $32.77 |
| Montana | $32.73 |
| Pennsylvania | $32.66 |
| Delaware | $32.54 |
| Missouri | $32.45 |
| Maine | $32.22 |
| Indiana | $32.07 |
| South Carolina | $32.05 |
| Nevada | $31.72 |
| Wyoming | $31.59 |
| Kansas | $31.51 |
| Alabama | $31.24 |
| South Dakota | $31.16 |
| Iowa | $30.94 |
| Tennessee | $30.75 |
| Oklahoma | $30.65 |
| Kentucky | $30.18 |
| Arkansas | $29.95 |
| West Virginia | $29.86 |
| New Mexico | $29.19 |
| Louisiana | $29.17 |
| Mississippi | $28.25 |
At the other end of the spectrum are Mississippi ($28.25) and Louisiana ($29.17)—the only two states with average wages below $30 per hour.
Northeastern states dominate the upper end of the scale, with Connecticut and New York joining Massachusetts above the $38/hour mark. In contrast, much of the South and Midwest sits closer to or below the national median. For example, Iowa ($30.94) and Indiana ($32.07) reflect more modest earnings common in the region.
When compared, the earnings gap between the highest (DC) and lowest (Mississippi) is more than $24 per hour. The federal minimum wage is currently $7.25 per hour for workers covered by the Fair Labor Standards Act (FLSA), though many states have set their own, often higher, minimum wage rates.
Learn More on the Voronoi App ![]()
If you enjoyed this map, check out this map on Voronoi about the income needed to buy a home in every U.S. state.