![]()
See more visuals like this on the Voronoi app.
Use This Visualization
Mapped: Chances of a White Christmas Across the U.S.
See visuals like this from many other data creators on our Voronoi app. Download it for free on iOS or Android and discover incredible data-driven charts from a variety of trusted sources.
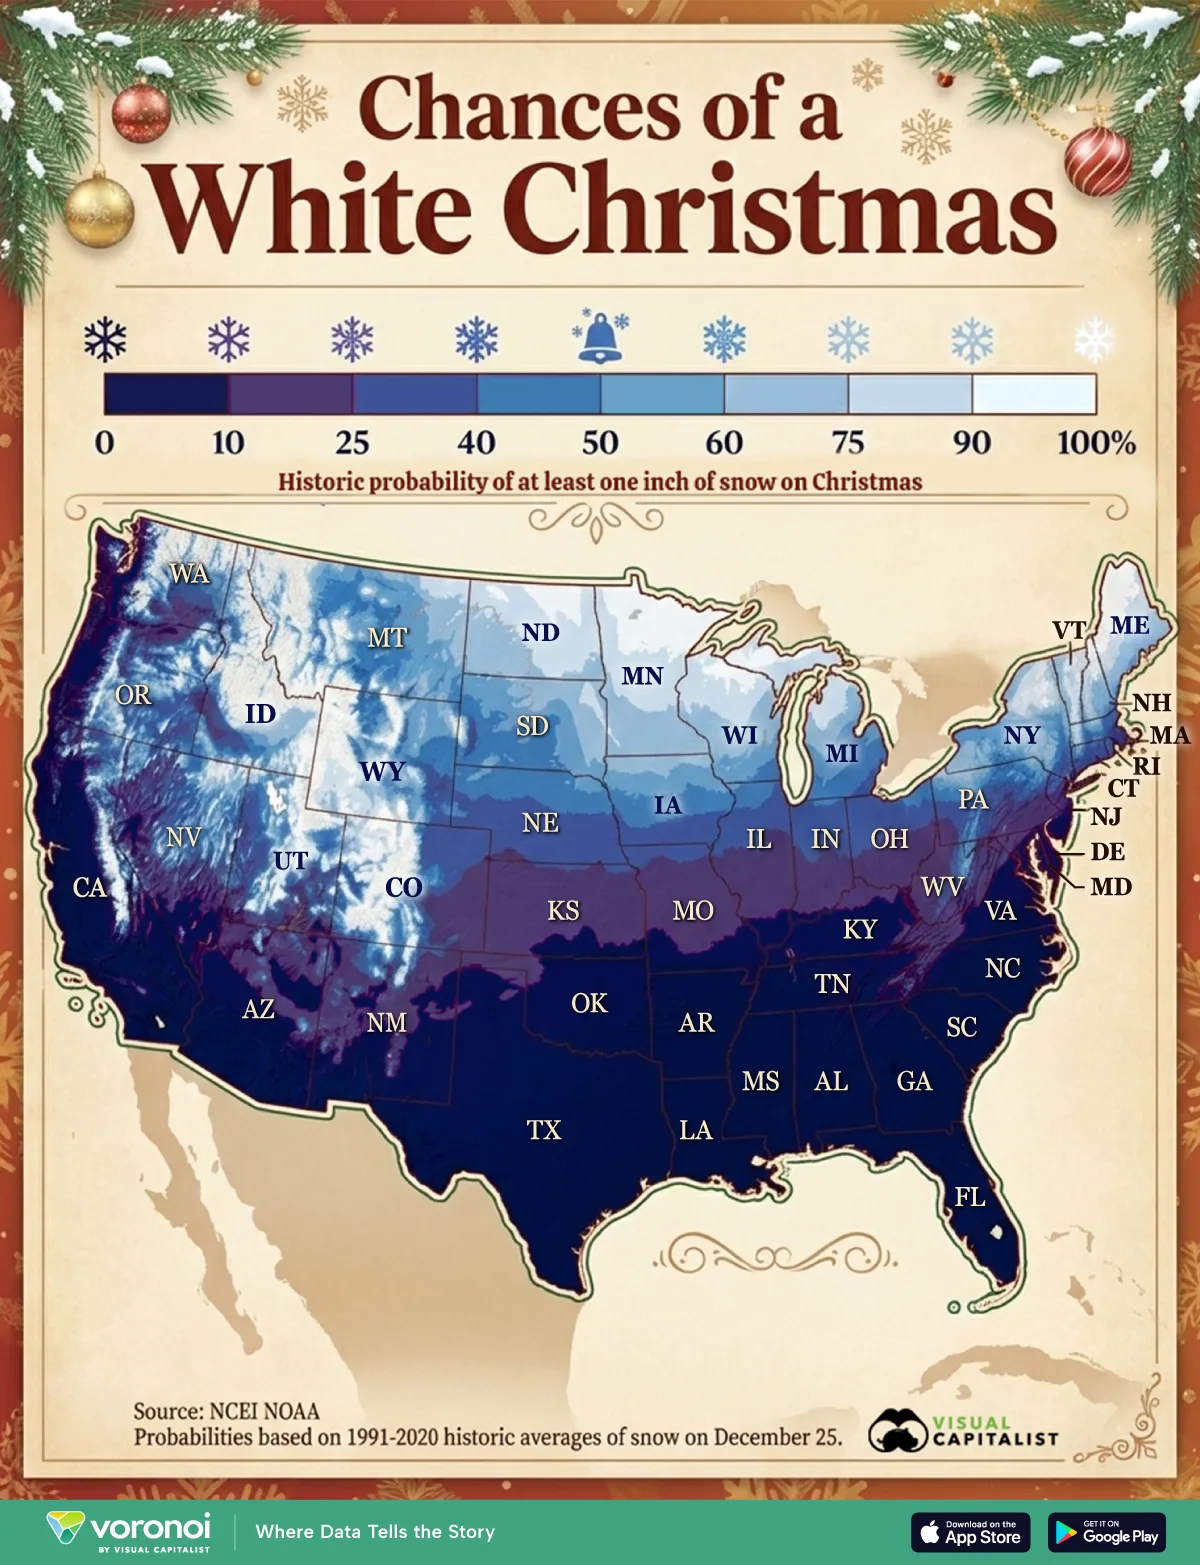
A white Christmas is one of those holiday experiences that feels universal—until you look at the weather history and actual odds of snowfall on Christmas Day across the United States.
This map shows the historic probability across the U.S. of seeing at least one inch of snow on the ground on December 25, using data from the NOAA National Centers for Environmental Information (NCEI) is based on the latest U.S. Climate Normals (1991–2020).
These “normals” are three-decade averages built from observations at nearly 15,000 stations, offering a consistent baseline for what’s typical in different parts of the country.
Latitude Matters Most For a Snow on Christmas Day
If you want the simplest rule of thumb for a white Christmas, head north. The northern Plains, Upper Midwest, and large stretches of the interior Northeast generally sit in higher probability bands than the rest of the country.
The data table below features state averages of NOAA’s full 5,000+ row dataset of specific station probabilities of at least one inch of snow:
| State | Average probability of at least one inch of snow on Christmas day |
|---|---|
| Alabama | 0.1% |
| Alaska | 84.3% |
| Arizona | 4.1% |
| Arkansas | 1.3% |
| California | 4.4% |
| Colorado | 48.7% |
| Connecticut | 35.2% |
| Delaware | 6.5% |
| Florida | 0.0% |
| Georgia | 0.4% |
| Hawaii | 0.0% |
| Idaho | 62.1% |
| Illinois | 27.2% |
| Indiana | 26.0% |
| Iowa | 46.9% |
| Kansas | 15.0% |
| Kentucky | 6.6% |
| Louisiana | 0.1% |
| Maine | 74.4% |
| Maryland | 11.2% |
| Massachusetts | 35.8% |
| Michigan | 64.8% |
| Minnesota | 75.2% |
| Mississippi | 0.2% |
| Missouri | 13.7% |
| Montana | 56.7% |
| Nebraska | 35.1% |
| Nevada | 17.8% |
| New Hampshire | 70.1% |
| New Jersey | 13.7% |
| New Mexico | 11.3% |
| New York | 55.9% |
| North Carolina | 3.1% |
| North Dakota | 77.3% |
| Ohio | 26.8% |
| Oklahoma | 3.1% |
| Oregon | 14.4% |
| Pennsylvania | 34.2% |
| Rhode Island | 26.9% |
| South Carolina | 0.6% |
| South Dakota | 55.5% |
| Tennessee | 2.8% |
| Texas | 0.8% |
| Utah | 46.2% |
| Vermont | 76.9% |
| Virginia | 8.6% |
| Washington | 26.9% |
| West Virginia | 26.8% |
| Wisconsin | 66.3% |
| Wyoming | 56.0% |
Areas around the Great Lakes can also improve their odds thanks to lake-effect snow, which can build persistent snowpack when cold air is in place.
Meanwhile, the further south you go, the more quickly the map shifts into darker shades—signaling that a white Christmas is historically uncommon.
Mountains Upgrade White Christmas Probabilities
Elevation can change the forecast more than any state line. The Rockies and the Sierra Nevada stand out as some of the most reliable places for holiday snow cover, with many high-altitude areas reaching the upper probabilities of Christmas Day snowfall.
The Cascades and ranges across Idaho also show strong odds, reinforcing how quickly temperatures drop with height.
Even in the East, the Appalachians make a visible difference—higher terrain can hold onto snow that the surrounding lowlands doesn’t.
Why the South and Coasts Often Miss White Christmas
Across the Gulf Coast, Deep South, and much of the Sun Belt, the map largely sits in the 0–10% range. Warmer winter temperatures mean snow is rarer to begin with—and even when it does fall, it’s less likely to stick around long enough to still be on the ground by Christmas morning.
Coastal climates often tilt milder as well, especially where ocean air moderates winter cold.
And for non-contiguous states, the story is mixed: Alaska’s station network is too sparse to confidently fill in the entire map, while Hawaii’s odds remain firmly at zero.
In other words, the classic “white Christmas” is real—but it’s also highly regional. If snow is the goal, history suggests two reliable strategies: chase colder latitudes, or climb into the mountains.
Learn More on the Voronoi App ![]()
For more Christmas-related visualizations, check out this graphic which ranks Spotify’s most streamed Christmas songs on Voronoi.