![]()
See this visualization first on the Voronoi app.
Use This Visualization
Mapped: Child Care Costs by State in 2025
This was originally posted on our Voronoi app. Download the app for free on iOS or Android and discover incredible data-driven charts from a variety of trusted sources.
Key Takeaways
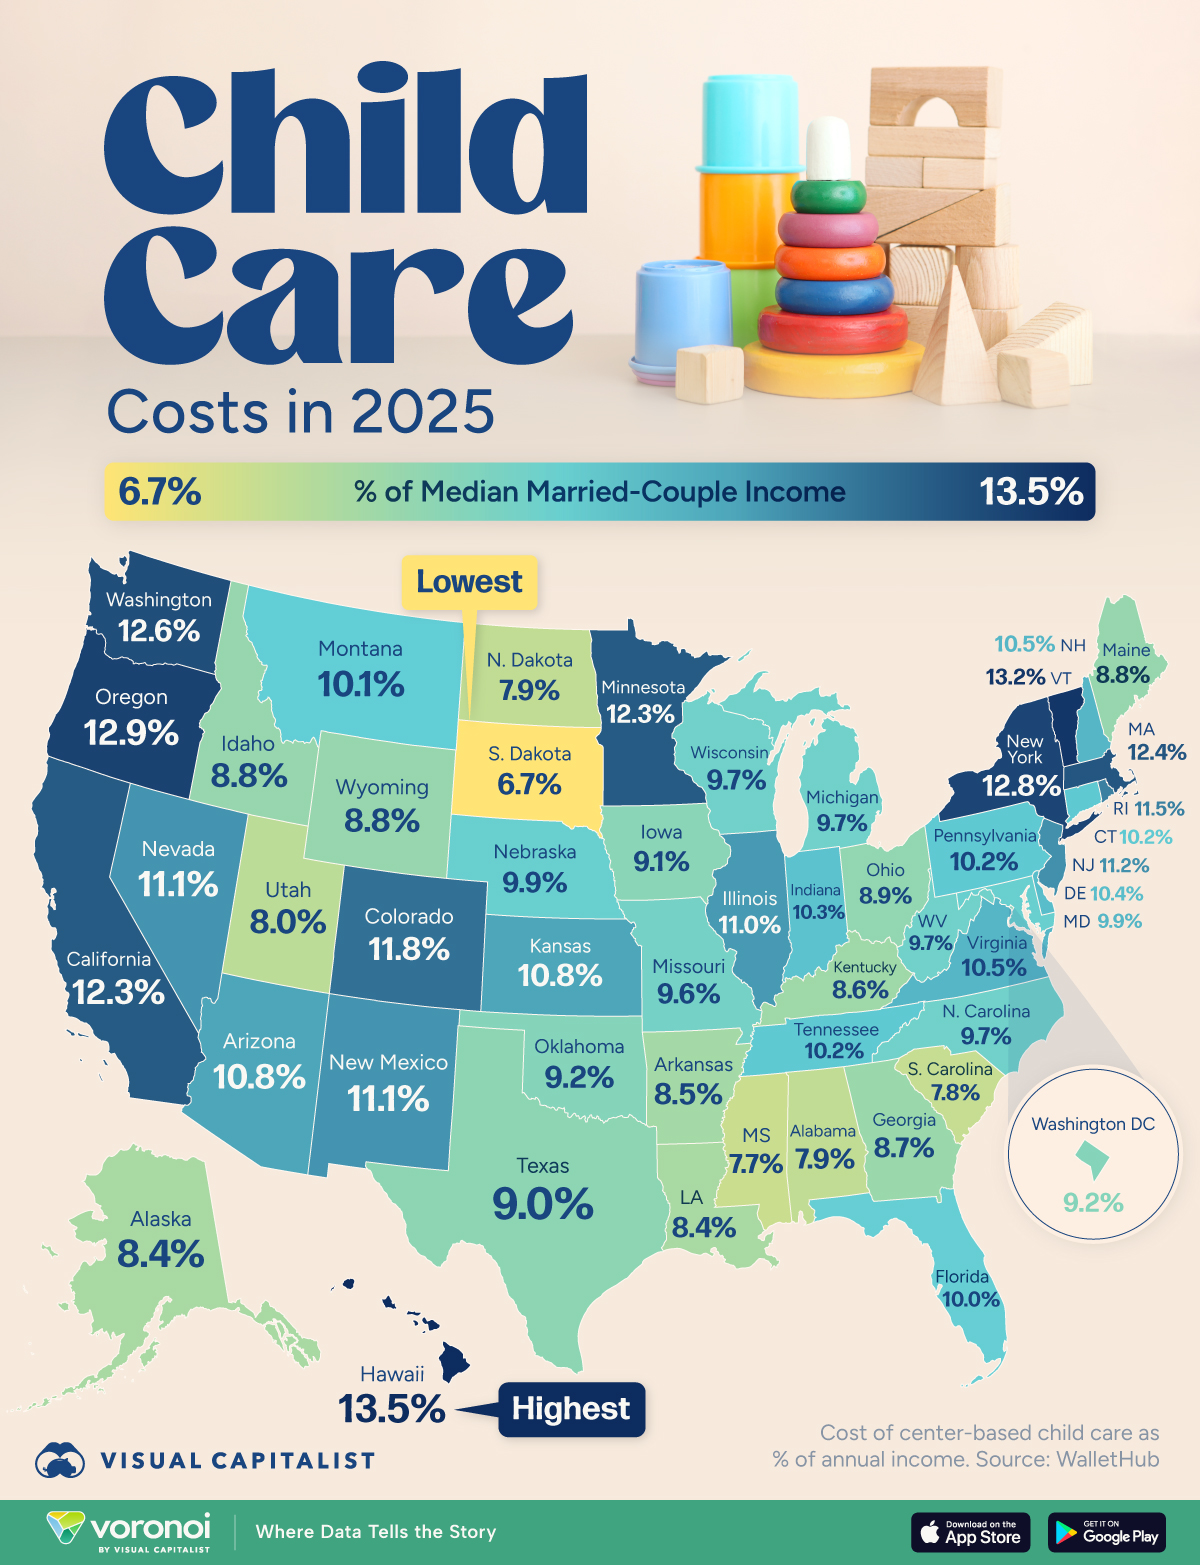
- The share of income spent on child care varies widely across U.S. states, from 6.7% in South Dakota to 13.5% in Hawaii.
- Several states—including Hawaii, Vermont, Oregon, and Washington—spend more than 12% of median married-couple income on child care.
In 2025, the cost of child care continues to be a significant financial burden for many American families. This map visualizes how much of a median married-couple’s annual income goes toward center-based child care in each U.S. state.
While some states maintain relatively modest costs, others require parents to allocate more than 12% of their household income, placing strain on budgets and amplifying regional inequities.
The data for this visualization comes from WalletHub, as of June 2025.
States with the Highest Child Care Burden
Hawaii tops the list, where families spend 13.5% of their income on child care. Vermont (13.2%), Oregon (12.9%), and Washington (12.6%) are close behind. These states significantly exceed the national median and point to higher cost-of-living pressures or limited child care availability.
Massachusetts (12.4%) and California (12.3%) also stand out, reinforcing the trend that coastal and northern states tend to face steeper costs.
More Affordable Child Care States
At the other end of the spectrum, South Dakota families spend just 6.7% of their income on child care, the lowest share in the country. Other affordable states include Mississippi (7.7%), South Carolina (7.8%), and Alabama (7.9%).
| State | Child Care Cost (% of Median Income) |
|---|---|
| Alabama | 7.9% |
| Alaska | 8.4% |
| Arizona | 10.8% |
| Arkansas | 8.5% |
| California | 12.3% |
| Colorado | 11.8% |
| Connecticut | 10.2% |
| Delaware | 10.4% |
| District of Columbia | 9.2% |
| Florida | 10.0% |
| Georgia | 8.7% |
| Hawaii | 13.5% |
| Idaho | 8.8% |
| Illinois | 11.0% |
| Indiana | 10.3% |
| Iowa | 9.1% |
| Kansas | 10.8% |
| Kentucky | 8.6% |
| Louisiana | 8.4% |
| Maine | 8.8% |
| Maryland | 9.9% |
| Massachusetts | 12.4% |
| Michigan | 9.7% |
| Minnesota | 12.3% |
| Mississippi | 7.7% |
| Missouri | 9.6% |
| Montana | 10.1% |
| Nebraska | 9.9% |
| Nevada | 11.1% |
| New Hampshire | 10.5% |
| New Jersey | 11.2% |
| New Mexico | 11.1% |
| New York | 12.8% |
| North Carolina | 9.7% |
| North Dakota | 7.9% |
| Ohio | 8.9% |
| Oklahoma | 9.2% |
| Oregon | 12.9% |
| Pennsylvania | 10.2% |
| Rhode Island | 11.5% |
| South Carolina | 7.8% |
| South Dakota | 6.7% |
| Tennessee | 10.2% |
| Texas | 9.0% |
| Utah | 8.0% |
| Vermont | 13.2% |
| Virginia | 10.5% |
| Washington | 12.6% |
| West Virginia | 9.7% |
| Wisconsin | 9.7% |
| Wyoming | 8.8% |
These lower percentages suggest more accessible or subsidized care options, particularly in parts of the South and Midwest.
Wider Economic Implications
Child care affordability remains a key barrier to workforce participation, especially for women. In states where costs consume a large portion of income, families may be forced to make difficult trade-offs or exit the labor force altogether.
Learn More on the Voronoi App ![]()
If you enjoyed today’s post, check out Mapped: Average House Prices by State on Voronoi, the new app from Visual Capitalist.