![]()
See this visualization first on the Voronoi app.
Use This Visualization
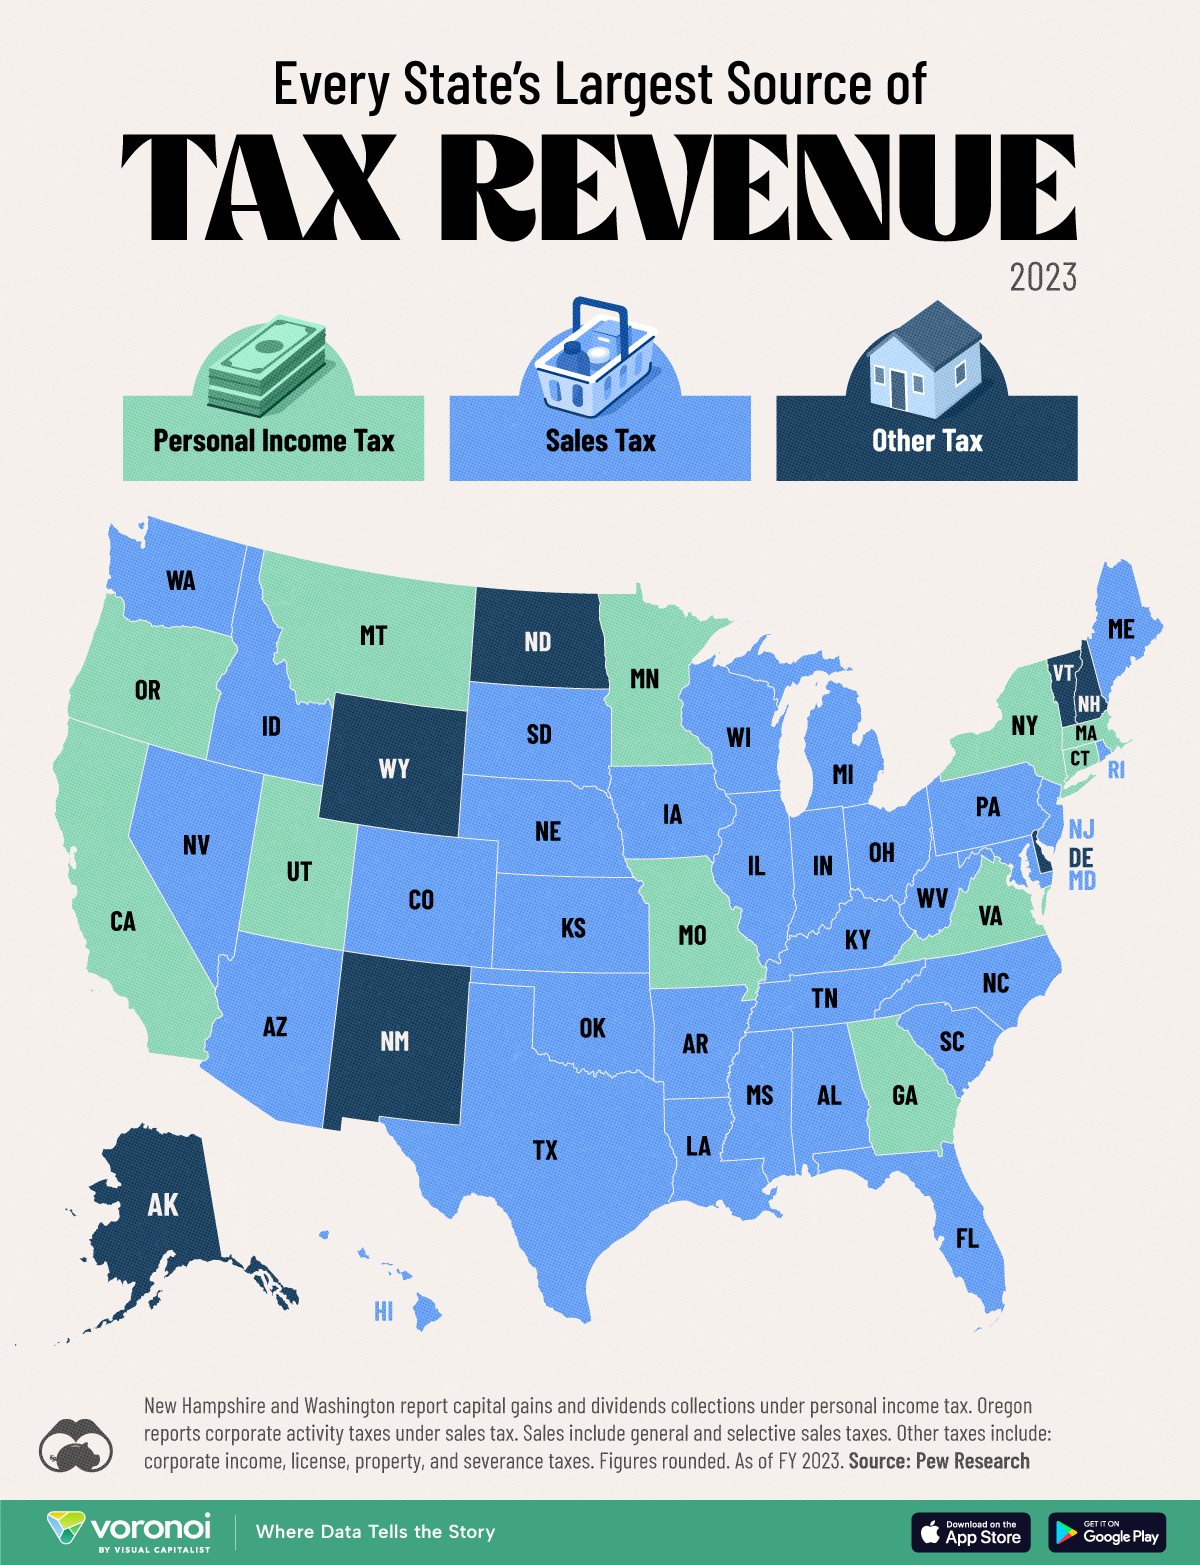
Mapped: Every State’s Biggest Source of Tax Revenue
This was originally posted on our Voronoi app. Download the app for free on iOS or Android and discover incredible data-driven charts from a variety of trusted sources.
Most of America’s federal government revenue is raised through personal and corporate income taxes. But how do individual states raise money for government activities?
We visualize each state’s largest source of tax revenue, color-coded by personal income, sales, or other taxes. Data was sourced from Pew Research and is current up to 2023.
Sales include general and selective sales taxes. Other taxes include levies on corporate income, licenses, property, and severance taxes.
Breaking Down Every State’s Tax Revenue Share
A vast majority of states raise most of their tax revenue through general and selective sales taxes. Here’s the share of each category to all the tax collected by each state.
| State | Personal Income Tax (%) |
Sales Tax (%) | Other Tax (%) |
|---|---|---|---|
| Alabama | 35 | 48 | 17 |
| Alaska | 0 | 9 | 91 |
| Arizona | 21 | 64 | 15 |
| Arkansas | 25 | 52 | 23 |
| California | 44 | 34 | 22 |
| Colorado | 37 | 44 | 19 |
| Connecticut | 40 | 40 | 20 |
| Delaware | 37 | 10 | 53 |
| Florida | 0 | 80 | 20 |
| Georgia | 49 | 35 | 16 |
| Hawaii | 30 | 61 | 9 |
| Idaho | 29 | 51 | 20 |
| Illinois | 35 | 43 | 22 |
| Indiana | 39 | 54 | 7 |
| Iowa | 36 | 48 | 16 |
| Kansas | 34 | 43 | 23 |
| Kentucky | 35 | 49 | 16 |
| Louisiana | 30 | 51 | 19 |
| Maine | 39 | 48 | 13 |
| Maryland | 41 | 43 | 16 |
| Massachusetts | 53 | 30 | 17 |
| Michigan | 31 | 49 | 20 |
| Minnesota | 41 | 37 | 22 |
| Mississippi | 23 | 64 | 13 |
| Missouri | 50 | 40 | 10 |
| Montana | 49 | 20 | 31 |
| Nebraska | 41 | 47 | 12 |
| Nevada | 0 | 77 | 23 |
| New Hampshire | 4 | 29 | 67 |
| New Jersey | 36 | 40 | 24 |
| New Mexico | 19 | 37 | 44 |
| New York | 47 | 26 | 27 |
| North Carolina | 43 | 46 | 11 |
| North Dakota | 8 | 30 | 62 |
| Ohio | 29 | 65 | 6 |
| Oklahoma | 32 | 40 | 28 |
| Oregon | 64 | 20 | 17 |
| Pennsylvania | 31 | 49 | 20 |
| Rhode Island | 34 | 55 | 11 |
| South Carolina | 37 | 48 | 15 |
| South Dakota | 0 | 85 | 15 |
| Tennessee | 0 | 74 | 26 |
| Texas | 0 | 85 | 15 |
| Utah | 48 | 41 | 11 |
| Vermont | 27 | 33 | 40 |
| Virginia | 45 | 38 | 17 |
| Washington | 2 | 74 | 24 |
| West Virginia | 35 | 45 | 20 |
| Wisconsin | 39 | 44 | 17 |
| Wyoming | 0 | 45 | 55 |
Note: Figures rounded. New Hampshire and Washington report capital gains and dividends collections under personal income tax. Oregon reports corporate activity taxes under sales tax.
For six states with no broad-based personal income tax (South Dakota, Florida, Texas, Nevada, Washington, and Tennessee), sales taxes contribute more than 70% to all tax dollars raised.
Then, in direct contrast to neighbor Washington, Oregon has no sales tax, so personal income tax is their majority collection.
For states with a higher median income (California, New York, Massachusetts) the largest share is personal income tax.
And then there are the states which don’t fall in either of the two main categories. For example, Alaska also has no personal income tax but makes most of its revenue through severance tax (listed under Other). It also benefits from the Permanent Fund and federal transfers.
Similarly, New Hampshire has no general sales or personal income tax. So, collections from corporate income and business profits are the majority sources of tax revenue.
Learn More on the Voronoi App ![]()
Wondering how much of your income goes towards the various state taxes? Check out Visualizing the Tax Burden of Every U.S. State for the ultimate breakdown.
The post Mapped: Every State’s Biggest Source of Tax Revenue appeared first on Visual Capitalist.