Written By Jenna Ross
Graphics & Design
- Alejandra Dander
Published February 7, 2023
•
Updated February 7, 2023
•
TweetShareShareRedditEmail
The following content is sponsored by The Hinrich Foundation
Geopolitical Risk by Economy
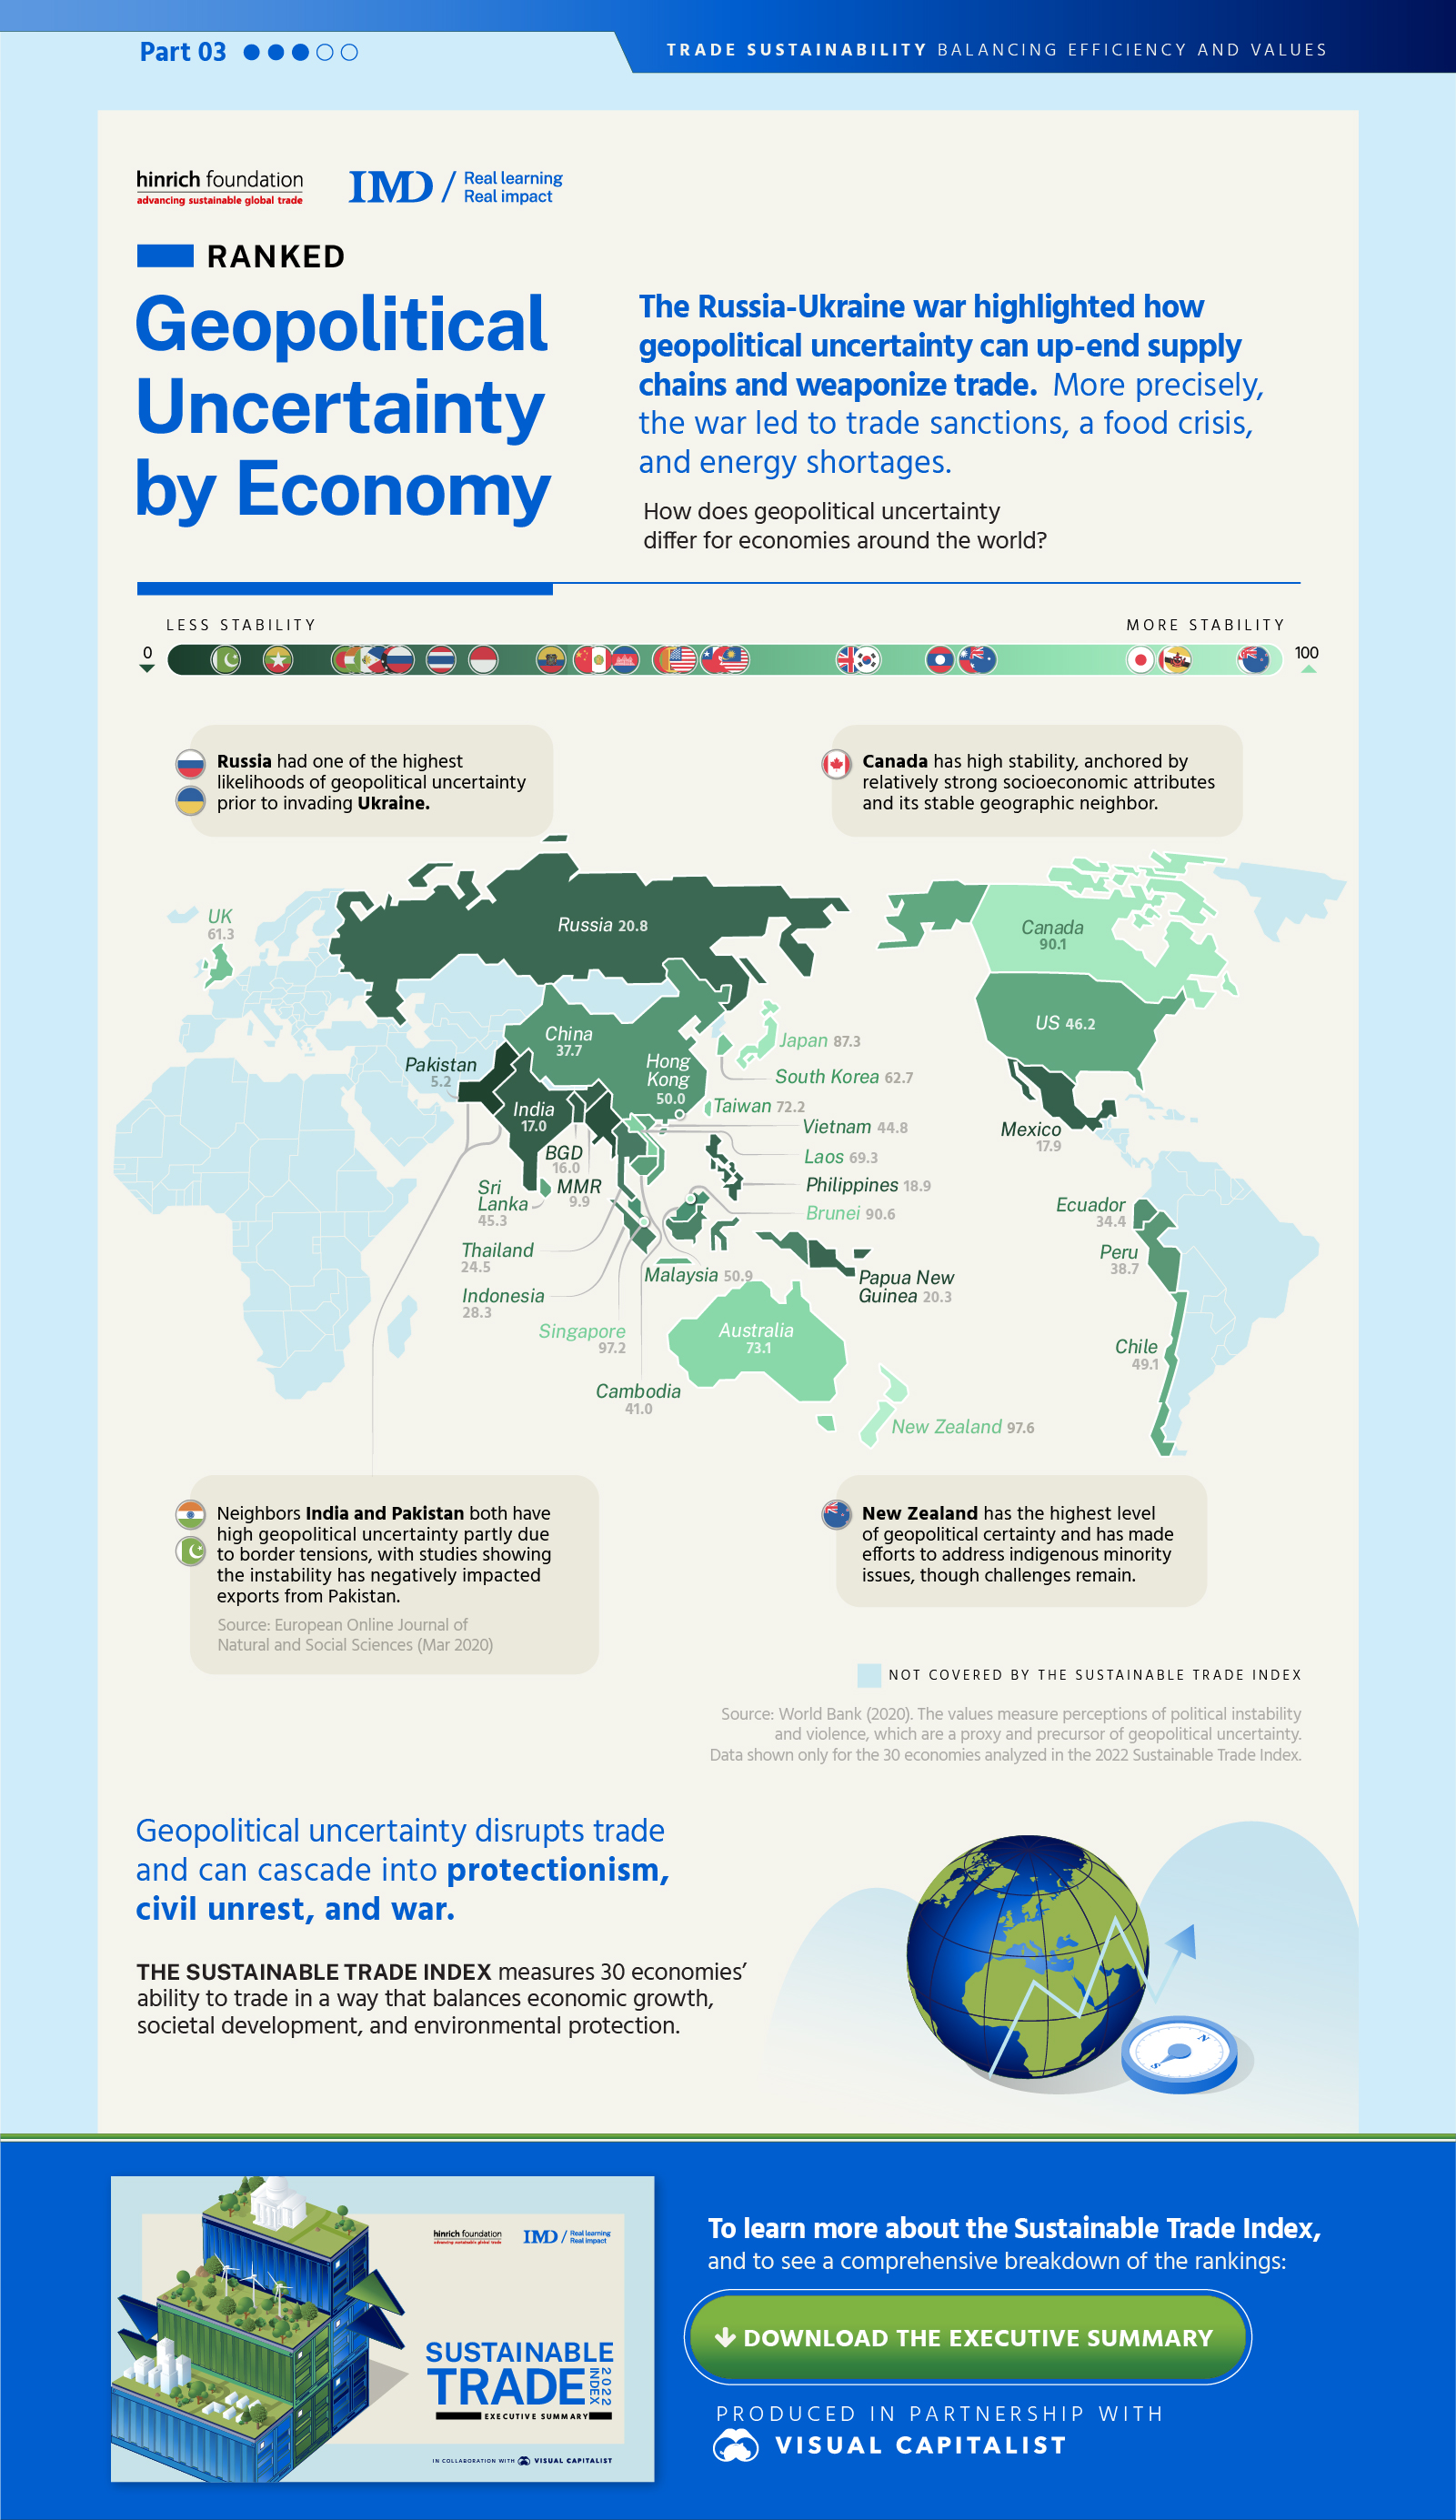
The Russia-Ukraine war highlighted how geopolitical risk can up-end supply chains and weaponize trade. More precisely, the war led to trade sanctions, a food crisis, and energy shortages.
This graphic from The Hinrich Foundation, the third in a five-part series on the sustainability of trade, explores how geopolitical risk differs by economy. It pulls data from the 2022 Sustainable Trade Index, which The Hinrich Foundation produced in collaboration with the IMD World Competitiveness Center.
Breaking Down Geopolitical Risk
Geopolitical risk has a strong correlation with GDP per capita, meaning that developing economies typically have less stability.
The following table shows how geopolitical risk breaks down for select economies that are covered in the 2022 Sustainable Trade Index. A lower number indicates less stability, while a higher number indicates more stability.
| Economy | Geopolitical Stability |
|---|---|
| Pakistan | 5.2 |
| Myanmar | 9.9 |
| Bangladesh | 16.0 |
| India | 17.0 |
| Mexico | 17.9 |
| Philippines | 18.9 |
| Papua New Guinea | 20.3 |
| Russia | 20.8 |
| Thailand | 24.5 |
| Indonesia | 28.3 |
| Ecuador | 34.4 |
| China | 37.7 |
| Peru | 38.7 |
| Cambodia | 41.0 |
| Vietnam | 44.8 |
| Sri Lanka | 45.3 |
| U.S. | 46.2 |
| Chile | 49.1 |
| Hong Kong | 50.0 |
| Malaysia | 50.9 |
| UK | 61.3 |
| South Korea | 62.7 |
| Laos | 69.3 |
| Taiwan | 72.2 |
| Australia | 73.1 |
| Japan | 87.3 |
| Canada | 90.1 |
| Brunei | 90.6 |
| Singapore | 97.2 |
| New Zealand | 97.6 |
Source: World Bank, based on the latest available data from 2020. Values measure perceptions of political instability and violence, which are a proxy and precursor to geopolitical risk.
New Zealand has the highest level of stability, likely supported by the fact that it is a small nation with no direct neighbors. The country has taken steps to repair relationships with Indigenous peoples, through land and monetary settlements, though challenges remain.
The U.S. has moderate stability. It has been impacted by increasing political polarization that has led to people having lower trust in institutions and more negative views of people from the opposing party. As the world’s largest economy, the U.S. also faces geopolitical risk such as escalating tariffs in the U.S.-China trade war.
Want more insights into trade sustainability?

Download the 2022 Sustainable Trade Index for free.
Russia has one of the lowest levels of stability. The country’s invasion of Ukraine has led to war along with economic roadblocks that restrict normal trade activity. For instance, sanctions against Russia and blocked Ukrainian ports led to a food shortage. The two countries supply a third of the world’s wheat and 75% of the sunflower oil supply.
The Impact of Geopolitical Uncertainty on Trade
Geopolitical risk can lead to civil unrest and war. It also has economic consequences including trade disruptions. As a result of the Russia-Ukraine war, the World Bank estimates that “world trade will drop by 1%, lowering global GDP by 0.7% and GDP of low-income economies by 1%.” A separate study found that Pakistan’s history of political instability has negatively affected trade in the country.
Of course, geopolitical risk is just one component of an economy’s trade sustainability. The Sustainable Trade Index uses a number of other metrics to measure economies’ ability to trade in a way that balances economic growth, societal development, and environmental protection. To learn more, visit the STI landing page where you can download the report for free.
The fourth piece in this series will explore air pollution by economy, and how it is influenced by economic activity such as trade.

Please enable JavaScript in your browser to complete this form.Subscribe to our free newsletter and get your mind blown on a daily basis: *Sign up
Related Topics: #trade #geopolitics #international trade #sustainable trade #Hinrich Foundation #Russia Ukraine war #political stability #economic sanctions
Click for Comments
var disqus_shortname = "visualcapitalist.disqus.com";
var disqus_title = "Mapped: Geopolitical Risk by Economy";
var disqus_url = "https://www.visualcapitalist.com/sp/geopolitical-risk-by-economy/";
var disqus_identifier = "visualcapitalist.disqus.com-155191";
You may also like
-
Technology2 hours ago
Ranked: America’s 20 Biggest Tech Layoffs Since 2020
How bad are the current layoffs in the tech sector? This visual reveals the 20 biggest tech layoffs since the start of the pandemic.
-

Datastream22 hours ago
Super-Sized Bets for Football’s Big Game (2013-2022)
Expanding legalization has driven an increase in bets on football’s big game, with wagers more than doubling from 2021 to 2022. (Sponsored Content)
-

Datastream4 days ago
Ranked: The Top Online Music Services in the U.S. by Monthly Users
This graphic shows the percentage of Americans that are monthly music listeners for each service. Which online music service is most popular?
-
Markets4 days ago
Charted: Tesla’s Unrivaled Profit Margins
This infographic compares Tesla’s impressive profit margins to various Western and Chinese competitors.
-
Markets5 days ago
Mapped: GDP Growth Forecasts by Country, in 2023
The global economy faces an uncertain future in 2023. This year, GDP growth is projected to be 2.9%—down from 3.2% in 2022.
-

Technology6 days ago
Infographic: Generative AI Explained by AI
What exactly is generative AI and how does it work? This infographic, created using generative AI tools such as Midjourney and ChatGPT, explains it all.
Subscribe
Please enable JavaScript in your browser to complete this form.Join the 365,000+ subscribers who receive our daily email *Sign Up
The post Mapped: Geopolitical Risk by Economy appeared first on Visual Capitalist.