![]()
See this visualization first on the Voronoi app.
Use This Visualization
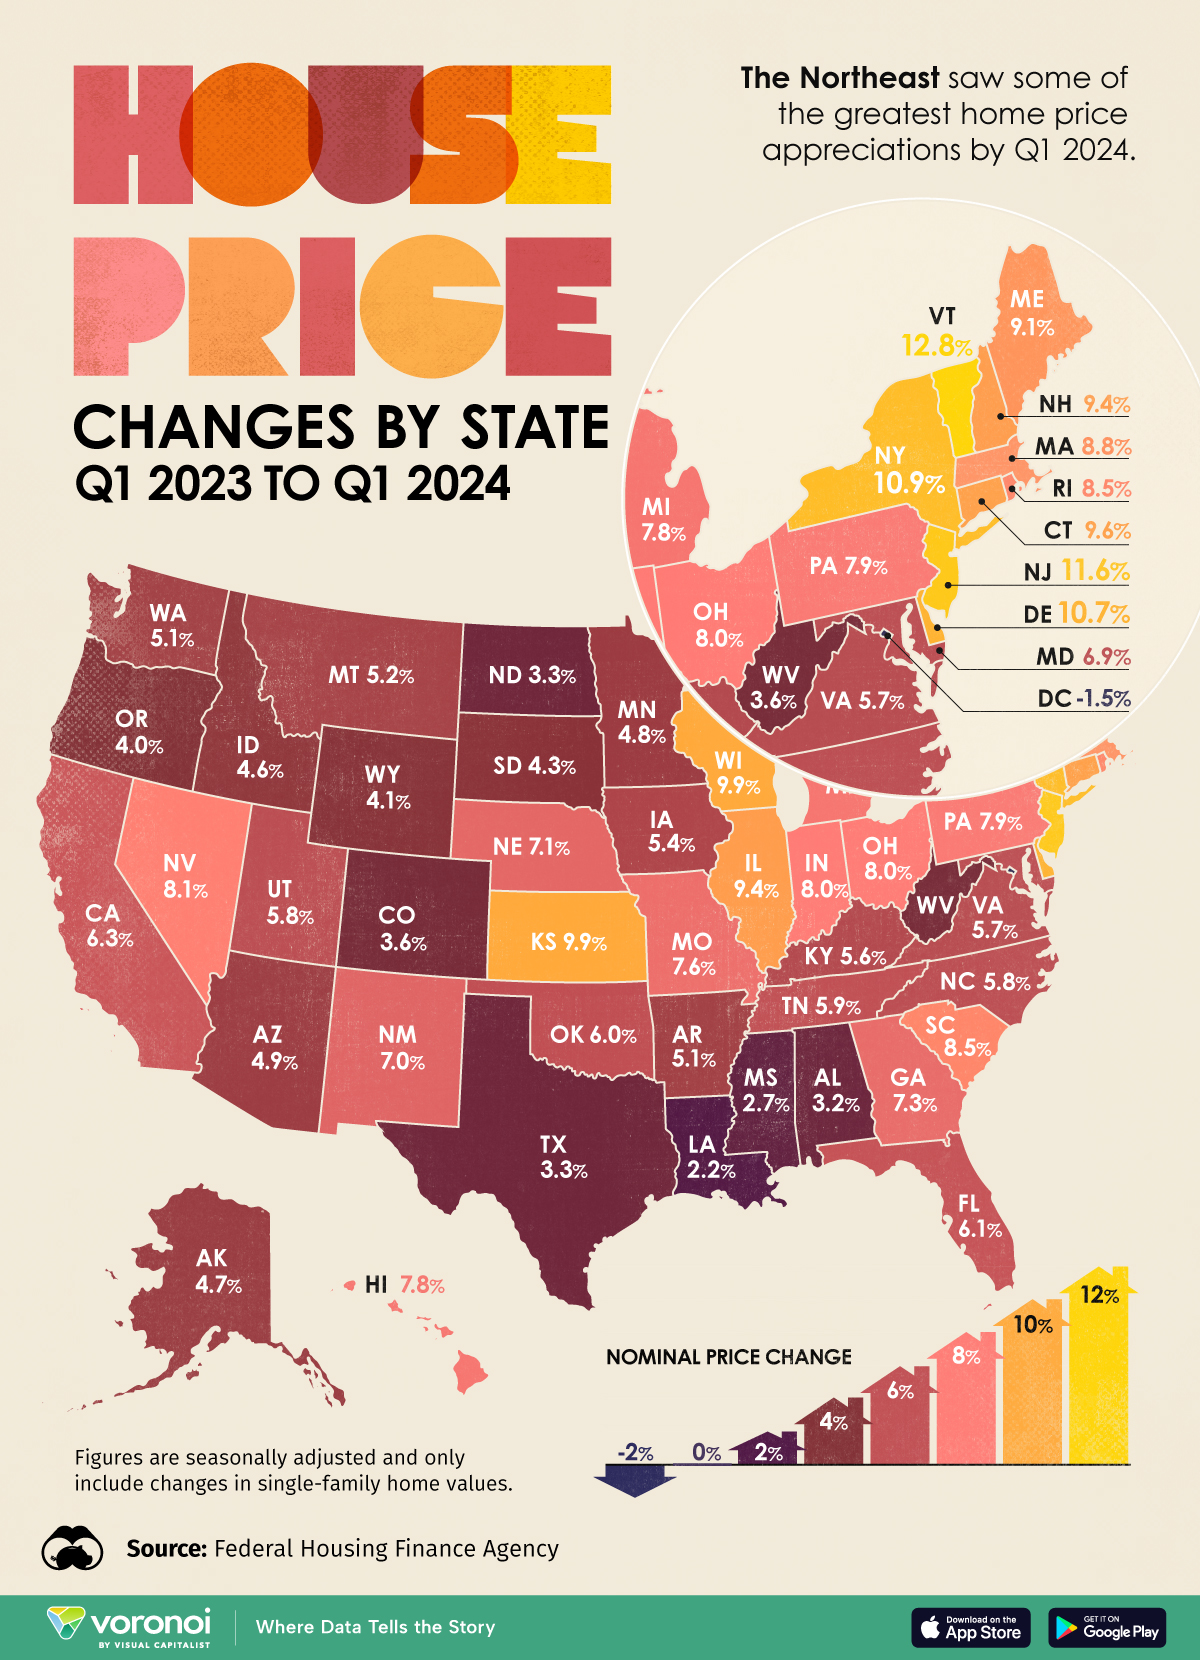
The Growth in House Prices by State in 2024
This was originally posted on our Voronoi app. Download the app for free on iOS or Android and discover incredible data-driven charts from a variety of trusted sources.
In 2024, U.S. home prices are steadily rising across nearly every state in America.
Overall, home prices rose 6.6% annually as of the first quarter of 2024, the highest increase since 2022. A combination of low inventory and homeowners’ reluctance to sell is driving up home values as interest rates remain persistently high.
The above graphic shows the growth in house prices by state in 2024, based on data from the Federal Housing Finance Agency.
Where Are Home Prices Rising the Fastest?
Below, we show the states with the greatest year-over-year home price growth in Q1 2024:
| Rank | State | House Price ChangeQ1 2023 - Q1 2024 |
|---|---|---|
| 1 | Vermont | 12.8% |
| 2 | New Jersey | 11.6% |
| 3 | New York | 10.9% |
| 4 | Delaware | 10.7% |
| 5 | Kansas | 9.9% |
| 6 | Wisconsin | 9.9% |
| 7 | Connecticut | 9.6% |
| 8 | Illinois | 9.4% |
| 9 | New Hampshire | 9.4% |
| 10 | Maine | 9.1% |
| 11 | Massachusetts | 8.8% |
| 12 | Rhode Island | 8.5% |
| 13 | South Carolina | 8.5% |
| 14 | Nevada | 8.1% |
| 15 | Indiana | 8.0% |
| 16 | Ohio | 8.0% |
| 17 | Pennsylvania | 7.9% |
| 18 | Hawaii | 7.8% |
| 19 | Michigan | 7.8% |
| 20 | Missouri | 7.6% |
| 21 | Georgia | 7.3% |
| 22 | Nebraska | 7.1% |
| 23 | New Mexico | 7.0% |
| 24 | Maryland | 6.9% |
| 25 | California | 6.3% |
| 26 | Florida | 6.1% |
| 27 | Oklahoma | 6.0% |
| 28 | Tennessee | 5.9% |
| 29 | North Carolina | 5.8% |
| 30 | Utah | 5.8% |
| 31 | Virginia | 5.7% |
| 32 | Kentucky | 5.6% |
| 33 | Iowa | 5.4% |
| 34 | Montana | 5.2% |
| 35 | Arkansas | 5.1% |
| 36 | Washington | 5.1% |
| 37 | Arizona | 4.9% |
| 38 | Minnesota | 4.8% |
| 39 | Alaska | 4.7% |
| 40 | Idaho | 4.6% |
| 41 | South Dakota | 4.3% |
| 42 | Wyoming | 4.1% |
| 43 | Oregon | 4.0% |
| 44 | Colorado | 3.6% |
| 45 | West Virginia | 3.6% |
| 46 | North Dakota | 3.3% |
| 47 | Texas | 3.3% |
| 48 | Alabama | 3.2% |
| 49 | Mississippi | 2.7% |
| 50 | Louisiana | 2.2% |
| 51 | District of Columbia | -1.5% |
Seasonally adjusted. Represents changes in single-family home values.
Vermont leads in growth, with home prices climbing by 12.8% as home inventory dropped to its lowest point in over a decade.
Next in line are Northeastern states New York, New Jersey, and Delaware—each with double-digit growth. Pushing up prices are the influx of buyers moving to more affordable metros nearby major cities along with a lack of inventory. On a metropolitan level, many of the nation’s hottest housing markets are in these states, including Camden, New Jersey and Syracuse, New York.
While Florida and Texas saw home prices surge over the pandemic, their property markets are cooling amid robust inventory gains. Between 2019 and 2023, over 25% of the nation’s single-family building permits were found in the two states. As home building activity is accelerating, the number of active listings is increasing, most notably in San Antonio, Texas and Tampa Bay, Florida.
Overall, home prices increased by 6.1% annually in Florida and 3.3% in Texas, falling below the national average.
Meanwhile, Washington, D.C. was the only district to see negative growth. Overall, home prices dropped -1.5% year-over-year as of Q1 2024. As one of the most expensive housing markets in the country, some buyers are waiting until interest rates fall before buying a home, which may be causing prices to moderate. Adding to this, over 20% of homes were valued above $1.5 million as of January 2024.
The post Mapped: The Growth in U.S. House Prices by State in 2024 appeared first on Visual Capitalist.