![]()
See this visualization first on the Voronoi app.
Use This Visualization
Mapped: States With the Highest Opioid Prescription Rates
This was originally posted on our Voronoi app. Download the app for free on iOS or Android and discover incredible data-driven charts from a variety of trusted sources.
Key Takeaways
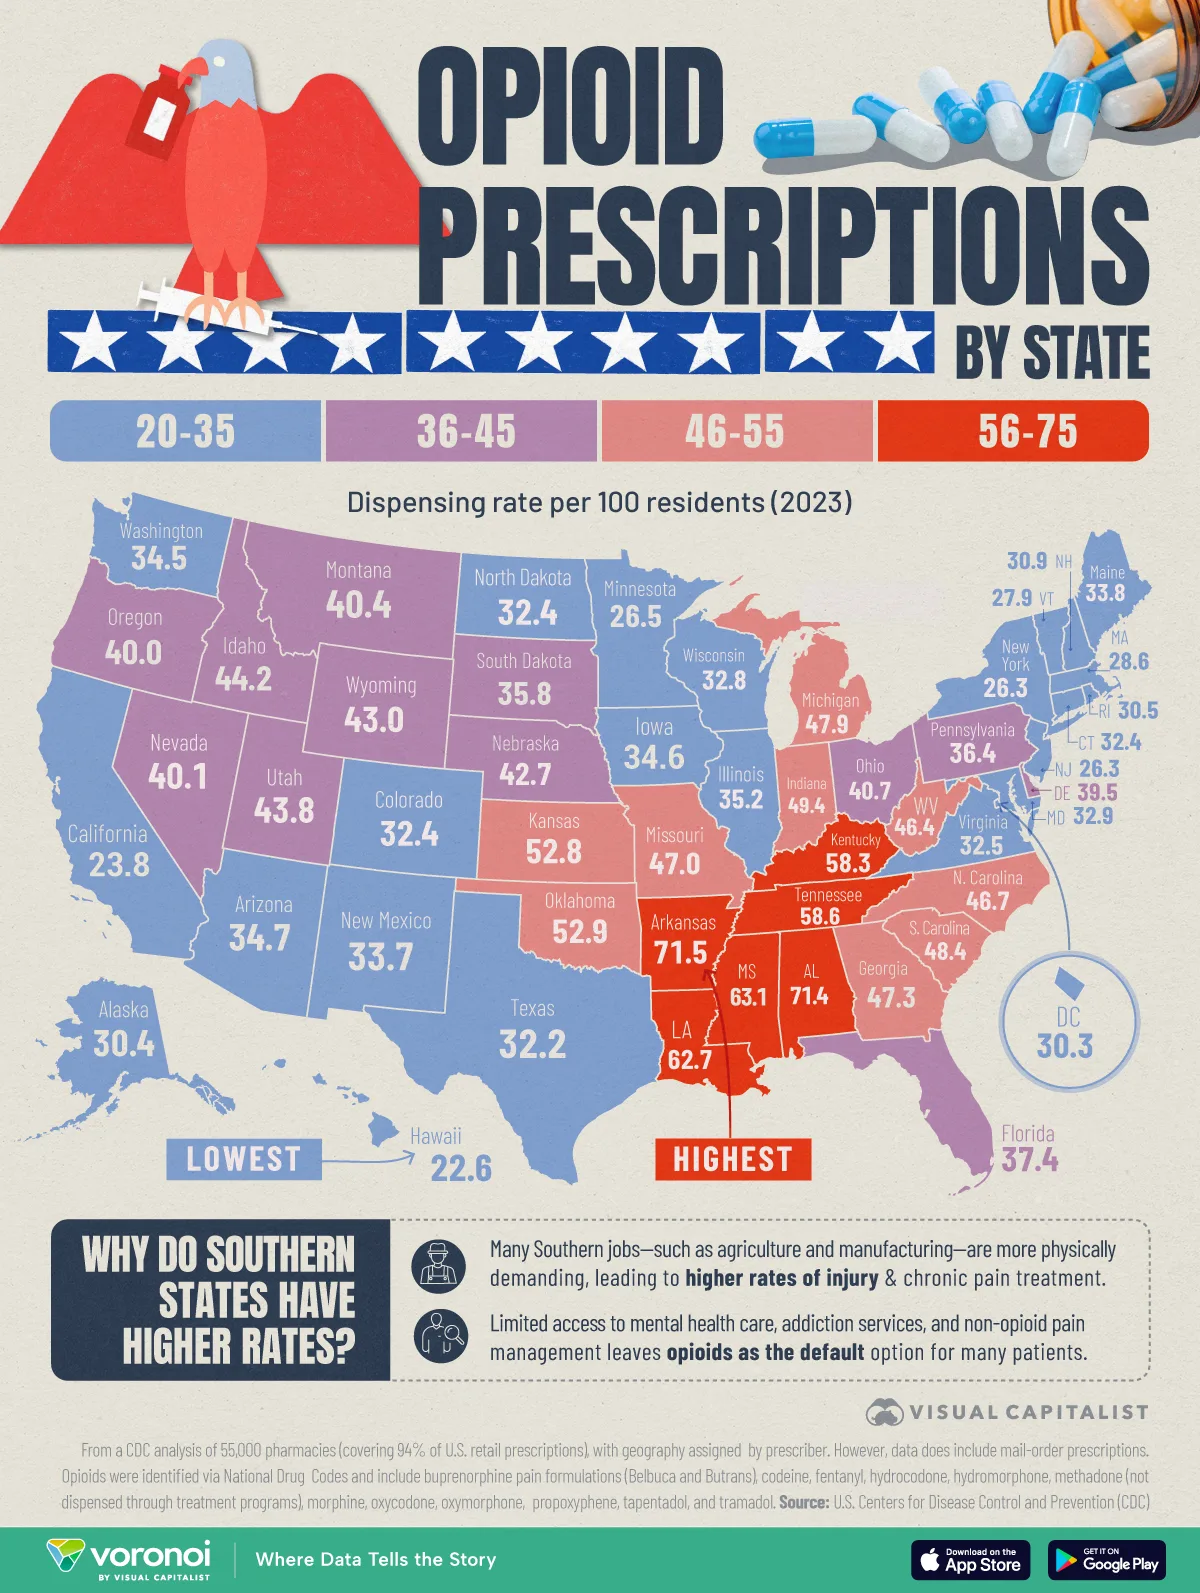
- Southern states had the highest opioid dispensing rates per 100 persons in 2023, including Arkansas (71.5), Alabama (71.4), Mississippi (63.1), and Louisiana (62.7).
- States with the lowest rates were spread out geographically: Hawaii (22.6), California (23.8), New Jersey (26.3), and New York (26.3).
More than a decade after prescription opioids saturated U.S. medicine cabinets, the crisis has crested, but it is still far from over.
In 2023, patients in some states filled more than three times as many prescriptions per capita as those in others, according to data from the Centers for Disease Control and Prevention (CDC).
Their state-level database tracks retail pharmacy opioid prescriptions dispensed per 100 residents, the same metric visualized in the accompanying map.
Ranked: Southern States Lead Opioid Prescription Rates
Arkansas tops the list at 71.5 prescriptions per 100 people, narrowly edging out Alabama (71.4).
Mississippi and Louisiana round out the top four, each exceeding 60 prescriptions per 100 persons.
| Rank | State | Code | Opioid Prescriptions Dispensed Per 100 Persons, 2023 |
|---|---|---|---|
| 1 | Arkansas | AR | 71.5 |
| 2 | Alabama | AL | 71.4 |
| 3 | Mississippi | MS | 63.1 |
| 4 | Louisiana | LA | 62.7 |
| 5 | Tennessee | TN | 58.6 |
| 6 | Kentucky | KY | 58.3 |
| 7 | Oklahoma | OK | 52.9 |
| 8 | Kansas | KS | 52.8 |
| 9 | Indiana | IN | 49.4 |
| 10 | South Carolina | SC | 48.4 |
| 11 | Michigan | MI | 47.9 |
| 12 | Georgia | GA | 47.3 |
| 13 | Missouri | MO | 47.0 |
| 14 | North Carolina | NC | 46.7 |
| 15 | West Virginia | WV | 46.4 |
| 16 | Idaho | ID | 44.2 |
| 17 | Utah | UT | 43.8 |
| 18 | Wyoming | WY | 43.0 |
| 19 | Nebraska | NE | 42.7 |
| 20 | Ohio | OH | 40.7 |
| 21 | Montana | MT | 40.4 |
| 22 | Nevada | NV | 40.1 |
| 23 | Oregon | OR | 40.0 |
| 24 | Delaware | DE | 39.5 |
| 25 | Florida | FL | 37.4 |
| 26 | Pennsylvania | PA | 36.4 |
| 27 | South Dakota | SD | 35.8 |
| 28 | Illinois | IL | 35.2 |
| 29 | Arizona | AZ | 34.7 |
| 30 | Iowa | IA | 34.6 |
| 31 | Washington | WA | 34.5 |
| 32 | Maine | ME | 33.8 |
| 33 | New Mexico | NM | 33.7 |
| 34 | Maryland | MD | 32.9 |
| 35 | Wisconsin | WI | 32.8 |
| 36 | Virginia | VA | 32.5 |
| 37 | Colorado | CO | 32.4 |
| 38 | Connecticut | CT | 32.4 |
| 39 | North Dakota | ND | 32.4 |
| 40 | Texas | TX | 32.2 |
| 41 | New Hampshire | NH | 30.9 |
| 42 | Rhode Island | RI | 30.5 |
| 43 | Alaska | AK | 30.4 |
| 44 | District Of Columbia | DC | 30.3 |
| 45 | Massachusetts | MA | 28.6 |
| 46 | Vermont | VT | 27.9 |
| 47 | Minnesota | MN | 26.5 |
| 48 | New Jersey | NJ | 26.3 |
| 49 | New York | NY | 26.3 |
| 50 | California | CA | 23.8 |
| 51 | Hawaii | HI | 22.6 |
Of the 10 states with the highest 2023 dispensing rates, eight sit in the South, and two in the lower Midwest.
Here are some of the reasons why:
- Many southern states experience higher rates of poverty, unemployment, and economic hardship, which correlate strongly with increased opioid prescribing and misuse.
- The region has a higher percentage of populations engaged in injury-prone occupations, leading to more pain-related medical visits and subsequent opioid prescriptions.
- Providers in southern states have historically received aggressive marketing from pharmaceutical companies for opioid medications, which contributed to more liberal prescribing practices.
- Health care disparities, including lower access to mental health and substance abuse treatment services, mean opioids are more likely to be prescribed for chronic or persistent pain.
- Sociocultural norms in the South may favor medication-based pain management over non-drug therapies, increasing opioid dispensing rates.
- The Deep South, with uniformly high rates of physical inactivity and chronic disease (including arthritis, diabetes, and obesity), presents more frequent cases of persistent pain—feeding demand for opioid prescriptions.
Together, these forces keep per-capita prescribing well above the national average of 37.5.
Related: The CDC states that prescription opioids are no longer the leading cause of overdose deaths. But this wasn’t always the case. Check out our quick explainer on America’s opioid crisis.
Coastal States Lows Reflect Stricter Opioid Policies
The lowest opioid prescription rates are scattered but share a policy thread.
Hawaii, California, New Jersey, and New York all fall below 27 prescriptions per 100 people.
Each has long-running prescription-drug-monitoring programs (PDMPs) and tighter pain-management guidelines.
Related: Missouri’s PDMP started in 2023.
California and New York also expanded Medicaid coverage for non-opioid treatments and require electronic prescribing, reducing “doctor-shopping” and handwritten fraud.
Hawaii’s isolation limits provider oversupply, while New Jersey’s 2017 law caps first-time opioid prescriptions to five days.
These measures collectively keep usage far below the national average.
National Opioid Prescription Rate Cut by Half Since 2012 Peak
Back in 2012, Americans filled 81.2 opioid prescriptions per 100 residents—the peak of the prescribing boom.
By 2023, the CDC reports that rate had dropped to 37.5, a 54% decline.
Major drivers include updated CDC guidelines in 2016, widespread PDMP adoption, and insurer limits on high-dose scripts.
Still, the U.S. average remains roughly triple the level seen in many European nations, and regional gaps persist.
Learn More on the Voronoi App ![]()
For related coverage, check out The Primary Causes of Overdose Deaths on Voronoi, the new app from Visual Capitalist.