Click to view a larger version of the graphic.
Mapped: The Top U.S. Imports by State
In 2021, the U.S. brought in approximately $2.83 trillion worth of goods from its various international trading partners.
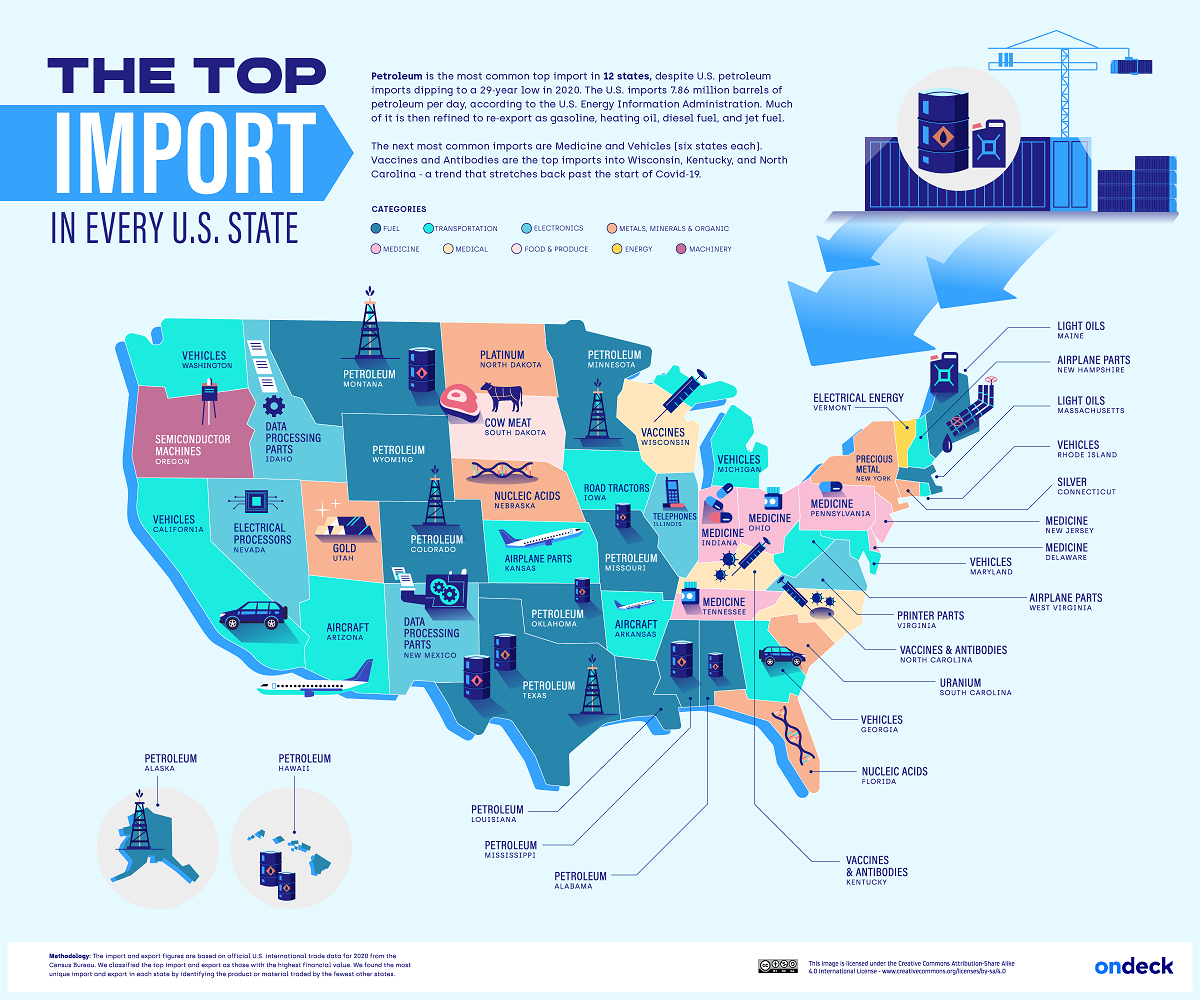
But what types of goods are most commonly imported throughout different parts of America? This graphic by OnDeck shows the top import in every U.S. state, using January 2022 data from the U.S. Census Bureau.
The Most Popular Categories of U.S. Imports
Petroleum is the most popular import in 12 states, making it the most common import across America. In 2021, about 72% of imported petroleum was crude oil, which was then domestically refined into products like gasoline, diesel, or jet fuel.
| State | Top Import |
|---|---|
| Alabama | Petroleum |
| Alaska | Petroleum |
| Arizona | Aircraft |
| Arkansas | Aircraft |
| California | Vehicles |
| Colorado | Petroleum |
| Connecticut | Silver |
| Delaware | Medicine |
| Florida | Nucleic Acids |
| Georgia | Vehicles |
| Hawaii | Petroleum |
| Idaho | Data Processing Parts |
| Illinois | Telephones |
| Indiana | Medicine |
| Iowa | Road Tractors |
| Kansas | Aircraft |
| Kentucky | Vaccines and Antibodies |
| Louisiana | Petroleum |
| Maine | Light Oils |
| Maryland | Vehicles |
| Massachusetts | Light Oils |
| Michigan | Vehicles |
| Minnesota | Petroleum |
| Mississippi | Petroleum |
| Missouri | Petroleum |
| Montana | Petroleum |
| Nebraska | Nucleic Acids |
| Nevada | Electrical Processors |
| New Hampshire | Aircraft |
| New Jersey | Medicine |
| New Mexico | Data Processing Parts |
| New York | Precious Metal |
| North Carolina | Vaccines and Antibodies |
| North Dakota | Platinum |
| Ohio | Medicine |
| Oklahoma | Petroleum |
| Oregon | Semiconductor Machines |
| Pennsylvania | Medicine |
| Rhode Island | Vehicles |
| South Carolina | Uranium |
| South Dakota | Cow Meat |
| Tennessee | Medicine |
| Texas | Petroleum |
| Utah | Gold |
| Vermont | Electrical Energy |
| Virginia | Printer Parts |
| Washington | Vehicles |
| West Virginia | Aircraft |
| Wisconsin | Vaccines |
| Wyoming | Petroleum |
A majority of that imported petroleum came from Canada, while roughly 11% was imported from OPEC countries, and 8% came from Russia. Of course, the latter figure will likely dip in 2022 because of the ban on Russian imports implemented by the Biden administration in response to the Russia-Ukraine conflict.
After petroleum, vehicles and medicine were tied for the second most-imported goods, with both categories being the most popular import in six states each.
Somewhat related to medicine are nucleic acids, which were the top imports in Florida and Nebraska. Nucleic acids are natural polymers that are used in biological processes like protein synthesis or messenger RNA (mRNA) translation. It’s worth noting that several COVID-19 vaccines, including those produced by Moderna and Pfizer-BioNTech, are mRNA vaccines.
The Most Unique U.S. Imports
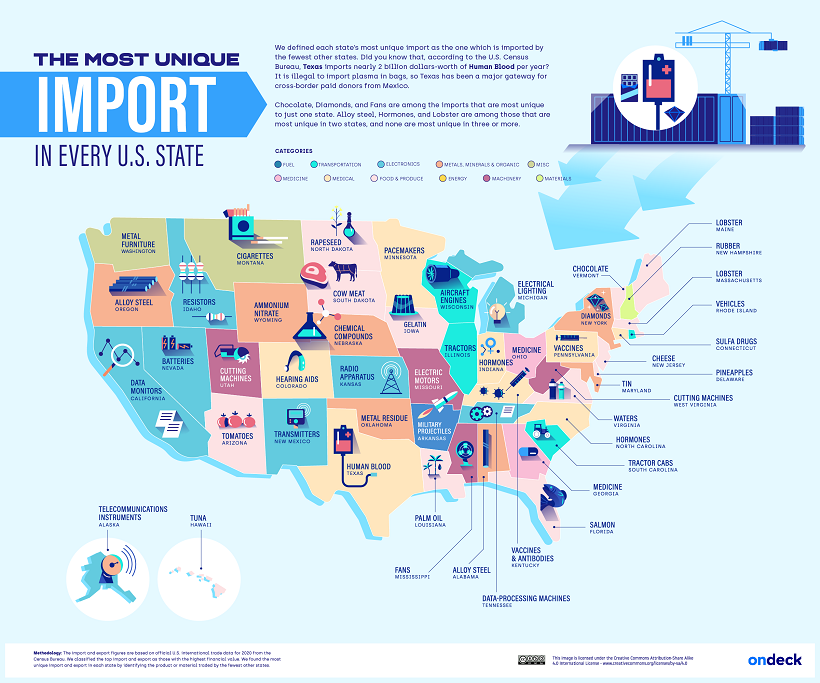
In addition to outlining the most popular imports in each U.S. state, OnDeck highlights each state’s most unique import, visualized in the graphic below.

High-resolution version
OnDeck defines each state’s “most unique” import as the category of goods that was imported by the fewest other states.
Salmon was Florida’s most unique import. This makes sense considering the Sunshine State is home to some of the country’s biggest seafood wholesalers, including North Star Seafood (owned by Sysco) and Tampa Bay Fisheries.
Another example is Delaware’s high imports of pineapples, totaling around $60.2 million in pineapples per year. This time, the culprit is Dole plc (formerly the Dole Food Company), the largest producer of fruit and vegetables in the world. Until 2021, the company’s headquarters were based in Delaware, and it still receives pineapple imports to the Port of Wilmington in the state’s largest city.
The post Mapped: The Top U.S. Imports by State appeared first on Visual Capitalist.