![]()
See more visuals like this on the Voronoi app.
Use This Visualization
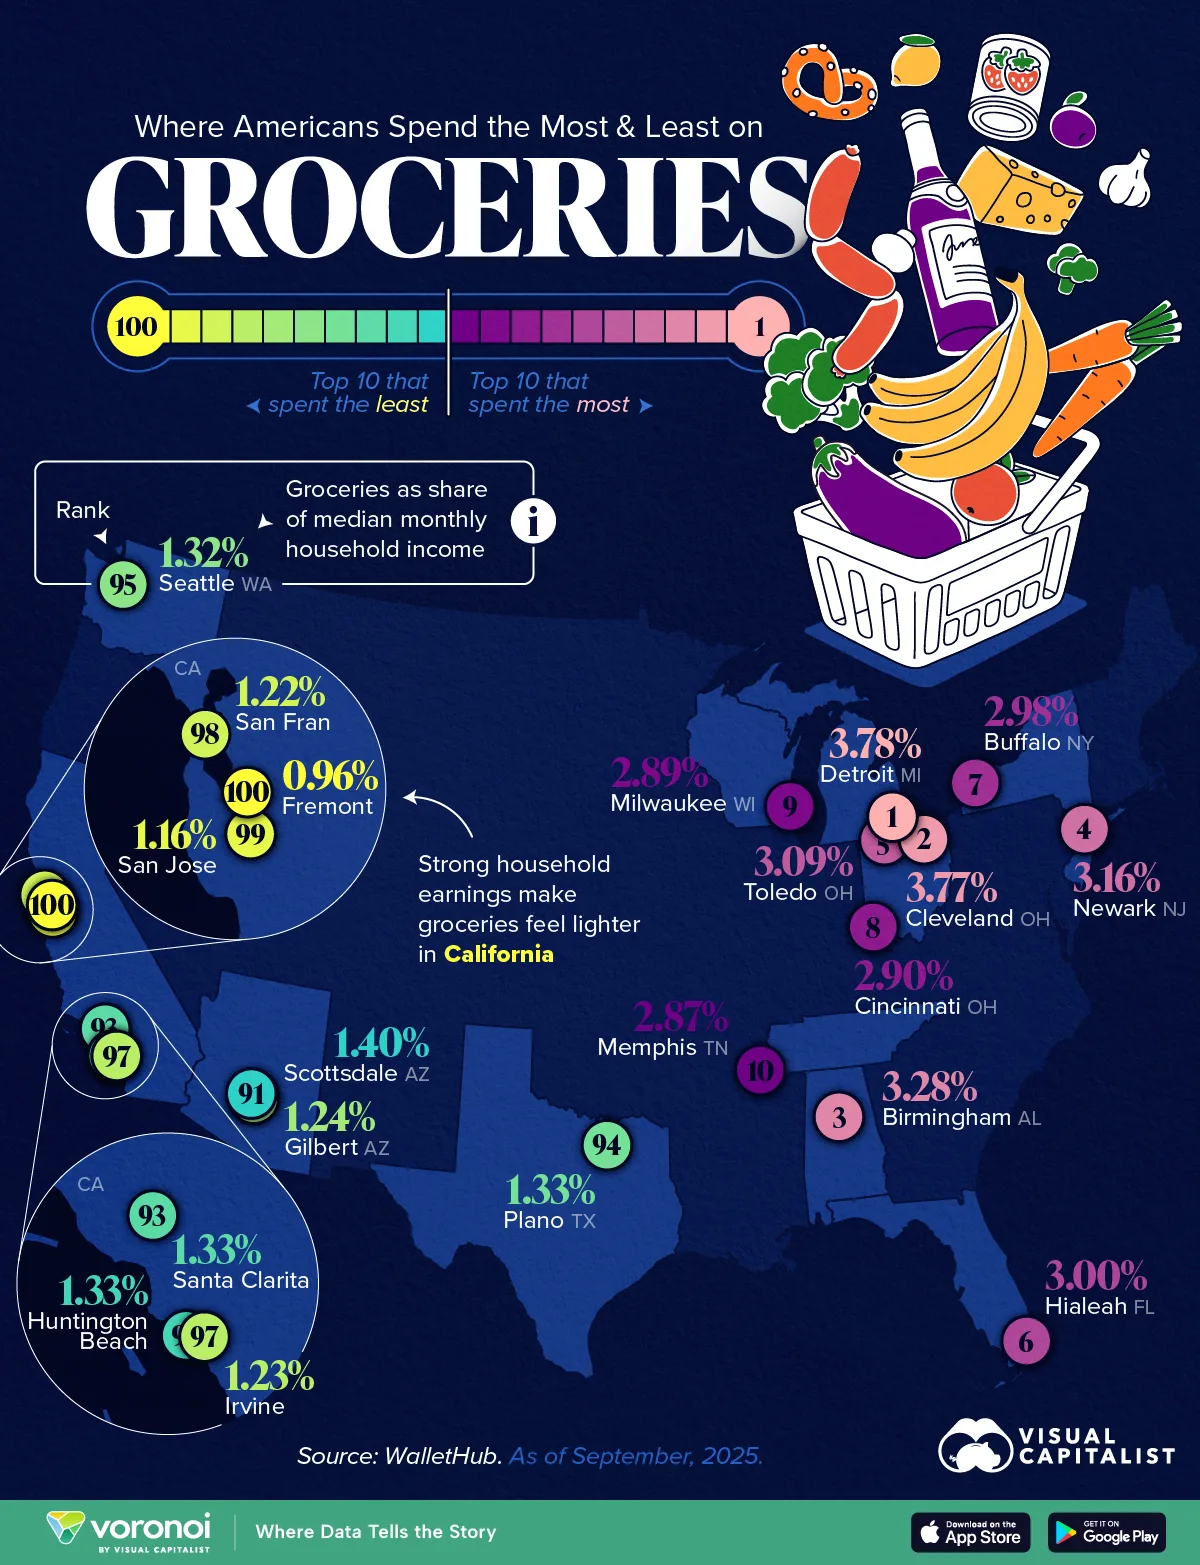
Cities Where People Spend the Most and Least on Groceries
See visuals like this from many other data creators on our Voronoi app. Download it for free on iOS or Android and discover incredible data-driven charts from a variety of trusted sources.
Key Takeaways
- Detroit households spend the largest share of their income on groceries, at nearly 4% of median monthly earnings.
- California cities dominate the list of places where groceries take up the smallest share of income.
In 2025, the gap between grocery affordability in different parts of the country highlights how far local incomes stretch.
This infographic ranks where Americans spend the most and least on groceries, as a share of median household income. The data for this visualization comes from WalletHub.
Where Groceries Cost the Most
Midwestern and Southern cities with lower household incomes see a greater share of paychecks going toward essentials. Meanwhile, wealthier coastal cities, despite higher sticker prices, experience less financial strain due to higher median earnings.
Detroit ranks highest, with groceries taking up 3.78% of median monthly income. With a median household income of roughly $39,575, everyday essentials weigh heavily on family budgets.
| Rank | City | Groceries as Share of Median Monthly Household Income |
|---|---|---|
| 1 | Detroit, MI | 3.78% |
| 2 | Cleveland, OH | 3.77% |
| 3 | Birmingham, AL | 3.28% |
| 4 | Newark, NJ | 3.16% |
| 5 | Toledo, OH | 3.09% |
| 6 | Hialeah, FL | 3.00% |
| 7 | Buffalo, NY | 2.98% |
| 8 | Cincinnati, OH | 2.90% |
| 9 | Milwaukee, WI | 2.89% |
| 10 | Memphis, TN | 2.87% |
Cities like Cleveland (3.77%) and Birmingham (3.28%) also rank near the top, reflecting similar economic pressures.
Where Groceries Are Most Affordable
At the other end, affluent cities like Fremont, California (0.96%) and San Jose (1.16%) spend the smallest share on groceries. Strong local wages make routine expenses feel lighter. California dominates this list, with seven of the 10 “most affordable” cities located in the state.
| Rank | City | Groceries as Share of Median Monthly Household Income |
|---|---|---|
| 91 | Scottsdale, AZ | 1.40% |
| 92 | Huntington Beach, CA | 1.33% |
| 93 | Santa Clarita, CA | 1.33% |
| 94 | Plano, TX | 1.33% |
| 95 | Seattle, WA | 1.32% |
| 96 | Gilbert, AZ | 1.24% |
| 97 | Irvine, CA | 1.23% |
| 98 | San Francisco, CA | 1.22% |
| 99 | San Jose, CA | 1.16% |
| 100 | Fremont, CA | 0.96% |
Sky-High Grocery Costs
Overall, U.S. food prices are more than 2% higher this year compared to 2024, and they could rise even further as a result of the Trump administration’s tariff policies.
In 2024, $221 billion in food was imported, with the top three by volume being liqueurs and spirits, baked goods, and coffee.
Learn More on the Voronoi App ![]()
If you enjoyed today’s post, check out Who’s Skipping the Doctor Due to Cost Reasons? on Voronoi, the new app from Visual Capitalist.