![]()
See more visuals like this on the Voronoi app.
Use This Visualization
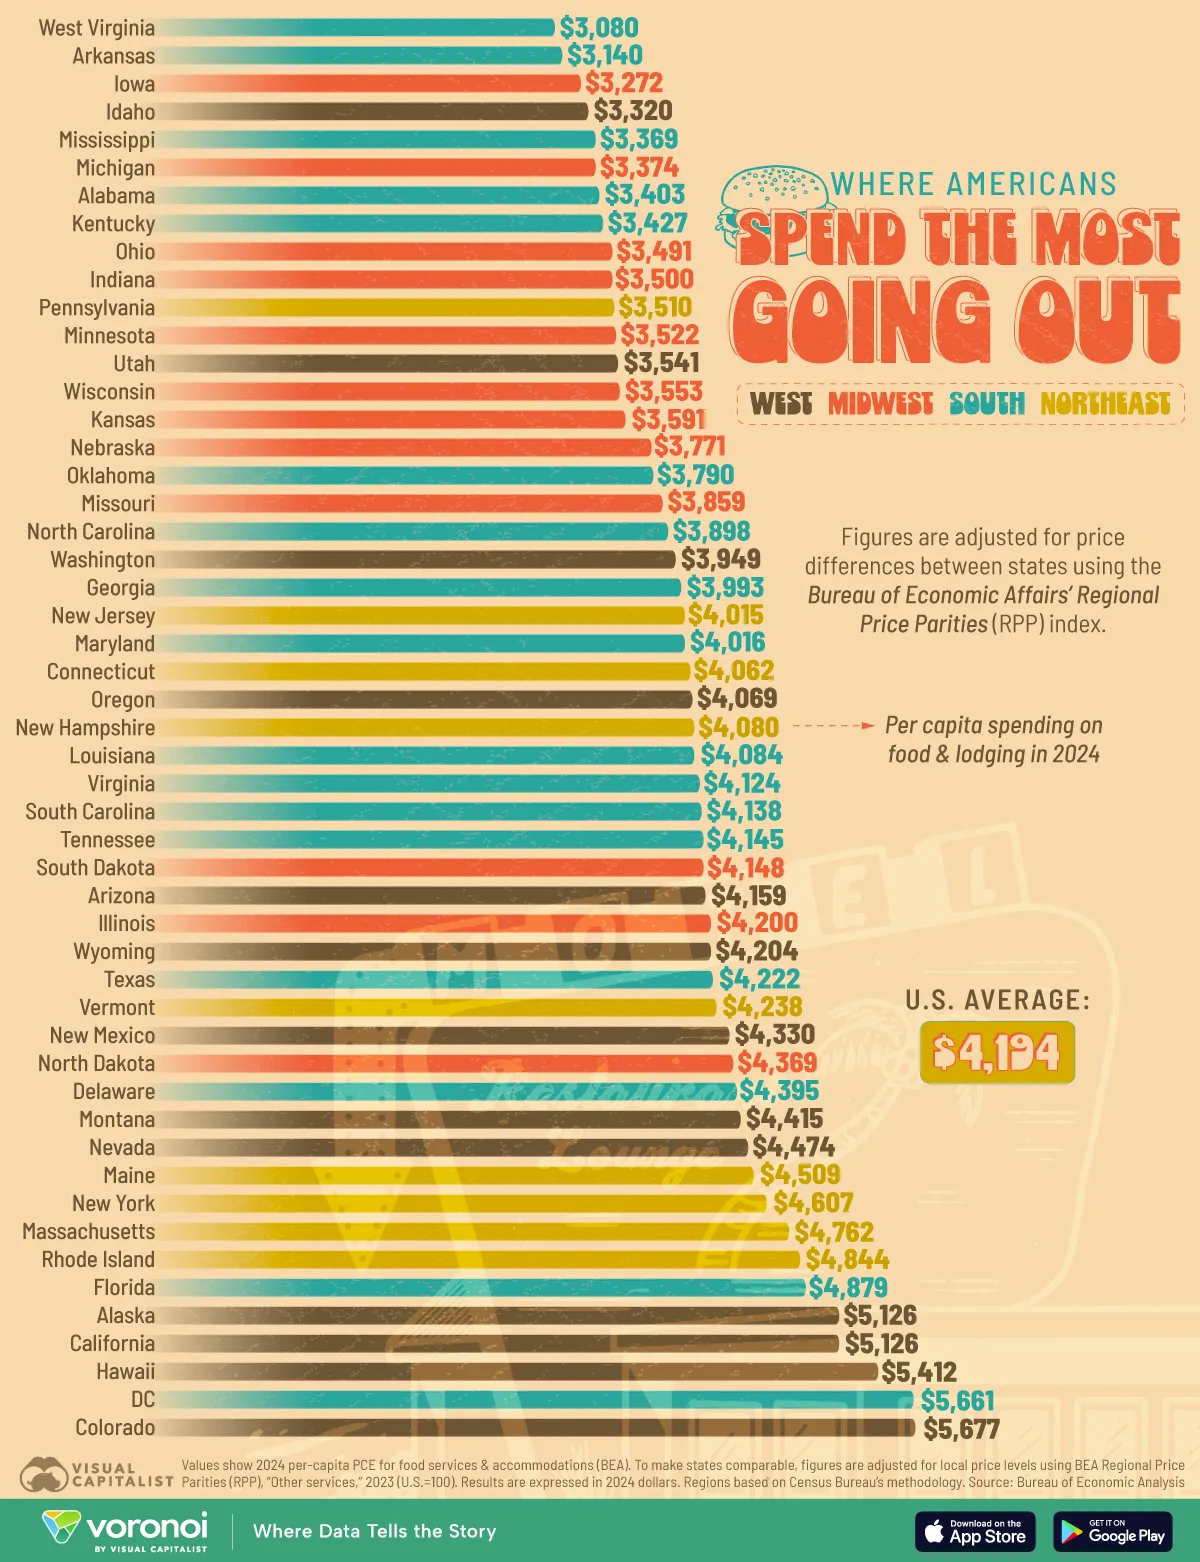
Ranked: U.S. States That Spend the Most on Going Out
See visuals like this from many other data creators on our Voronoi app. Download it for free on iOS or Android and discover incredible data-driven charts from a variety of trusted sources.
Key Takeaways
- Colorado residents spend the most on going out, about $5,600 each year eating out or staying in hotel accommodations.
- This is the highest in the country, after adjusting for price differences between states.
- Despite the cost accounting, wealthier states still spend more, suggesting that states with higher incomes have greater discretionary spending.
From après-ski dinners in Denver to double espressos in Honolulu, Americans love treating themselves when they go out.
But how much they’re willing (and able) to spend varies widely.
This chart ranks all 50 states and the District of Columbia by their per-capita spending on food services and accommodation in 2024, after stripping out regional price differences.
Data for this visualization comes from Bureau of Economic Analysis.
To make states comparable, figures are adjusted for local price levels using BEA Regional Price Parities (RPP) for “Other Services” based on 2023 data. Regions are based on Census Bureau’s methodology. Results are expressed in 2024 dollars.
As 2024 category RPPs are not yet published, 2023 is used as a proxy as year-to-year changes in relative price levels are typically small.
Where Americans Spend the Most Going Out, by State
Topping the list, Colorado residents shell out an average of $5,677 per person, about $1,500 above the U.S. norm.
| Rank | State | Region | State Code | Per capita spending on food & lodging in 2024 |
|---|---|---|---|---|
| 1 | Colorado | West | CO | $5,677 |
| 2 | District of Columbia | South | DC | $5,661 |
| 3 | Hawaii | West | HI | $5,412 |
| 4 | Alaska | West | AK | $5,126 |
| 5 | California | West | CA | $5,126 |
| 6 | Florida | South | FL | $4,879 |
| 7 | Rhode Island | Northeast | RI | $4,844 |
| 8 | Massachusetts | Northeast | MA | $4,762 |
| 9 | New York | Northeast | NY | $4,607 |
| 10 | Maine | Northeast | ME | $4,509 |
| 11 | Nevada | West | NV | $4,474 |
| 12 | Montana | West | MT | $4,415 |
| 13 | Delaware | South | DE | $4,395 |
| 14 | North Dakota | Midwest | ND | $4,369 |
| 15 | New Mexico | West | NM | $4,330 |
| 16 | Vermont | Northeast | VT | $4,238 |
| 17 | Texas | South | TX | $4,222 |
| 18 | Wyoming | West | WY | $4,204 |
| 19 | Illinois | Midwest | IL | $4,200 |
| 20 | Arizona | West | AZ | $4,159 |
| 21 | South Dakota | Midwest | SD | $4,148 |
| 22 | Tennessee | South | TN | $4,145 |
| 23 | South Carolina | South | SC | $4,138 |
| 24 | Virginia | South | VA | $4,124 |
| 25 | Louisiana | South | LA | $4,084 |
| 26 | New Hampshire | Northeast | NH | $4,080 |
| 27 | Oregon | West | OR | $4,069 |
| 28 | Connecticut | Northeast | CT | $4,062 |
| 29 | Maryland | South | MD | $4,016 |
| 30 | New Jersey | Northeast | NJ | $4,015 |
| 31 | Georgia | South | GA | $3,993 |
| 32 | Washington | West | WA | $3,949 |
| 33 | North Carolina | South | NC | $3,898 |
| 34 | Missouri | Midwest | MO | $3,859 |
| 35 | Oklahoma | South | OK | $3,790 |
| 36 | Nebraska | Midwest | NE | $3,771 |
| 37 | Kansas | Midwest | KS | $3,591 |
| 38 | Wisconsin | Midwest | WI | $3,553 |
| 39 | Utah | West | UT | $3,541 |
| 40 | Minnesota | Midwest | MN | $3,522 |
| 41 | Pennsylvania | Northeast | PA | $3,510 |
| 42 | Indiana | Midwest | IN | $3,500 |
| 43 | Ohio | Midwest | OH | $3,491 |
| 44 | Kentucky | South | KY | $3,427 |
| 45 | Alabama | South | AL | $3,403 |
| 46 | Michigan | Midwest | MI | $3,374 |
| 47 | Mississippi | South | MS | $3,369 |
| 48 | Idaho | West | ID | $3,320 |
| 49 | Iowa | Midwest | IA | $3,272 |
| 50 | Arkansas | South | AR | $3,140 |
| 51 | West Virginia | South | WV | $3,080 |
| N/A | U.S. Average | N/A | USA | $4,194 |
Right behind is the District of Columbia at $5,661, where a dense concentration of restaurants that caters to well-paid professionals.
Hawaii ($5,412), Alaska ($5,126), and California ($5,126) round out the five biggest spenders
This reflects both tourism-driven economies and higher household incomes, a clear mix of how prosperity and lifestyle intersect. Higher wages provide the discretionary cushion, while vibrant leisure industries offer plenty of ways to spend it.
Related: Look at the latest estimates for household income by state.
The Midwest Prefers Eating In
Regional patterns emerge quickly. Western states lead with an average of $4,446, buoyed by tourism hotspots and hip urban centers.
The Northeast follows at $4,292, helped by dense cityscapes like New York and Boston.
Meanwhile, Midwestern states average just $3,721, a full $700 below the U.S. average.
At the bottom sit West Virginia ($3,080), Arkansas ($3,140), Iowa ($3,272), Idaho ($3,320), and Mississippi ($3,369).
Learn More on the Voronoi App ![]()
If you enjoyed today’s post, check out the Minimum Wages in All 50 States and 35 Countries, Adjusted for Living Costs on Voronoi, the new app from Visual Capitalist.