Published
13 mins ago
on
January 31, 2024
| 29 views
-->
By
Alan Kennedy
Graphics & Design
- Sabrina Fortin
- Zack Aboulazm
The following content is sponsored by Global X ETFs
Part Three: Mapping U.S. Investment in Sustainable Infrastructure (2021-2023)
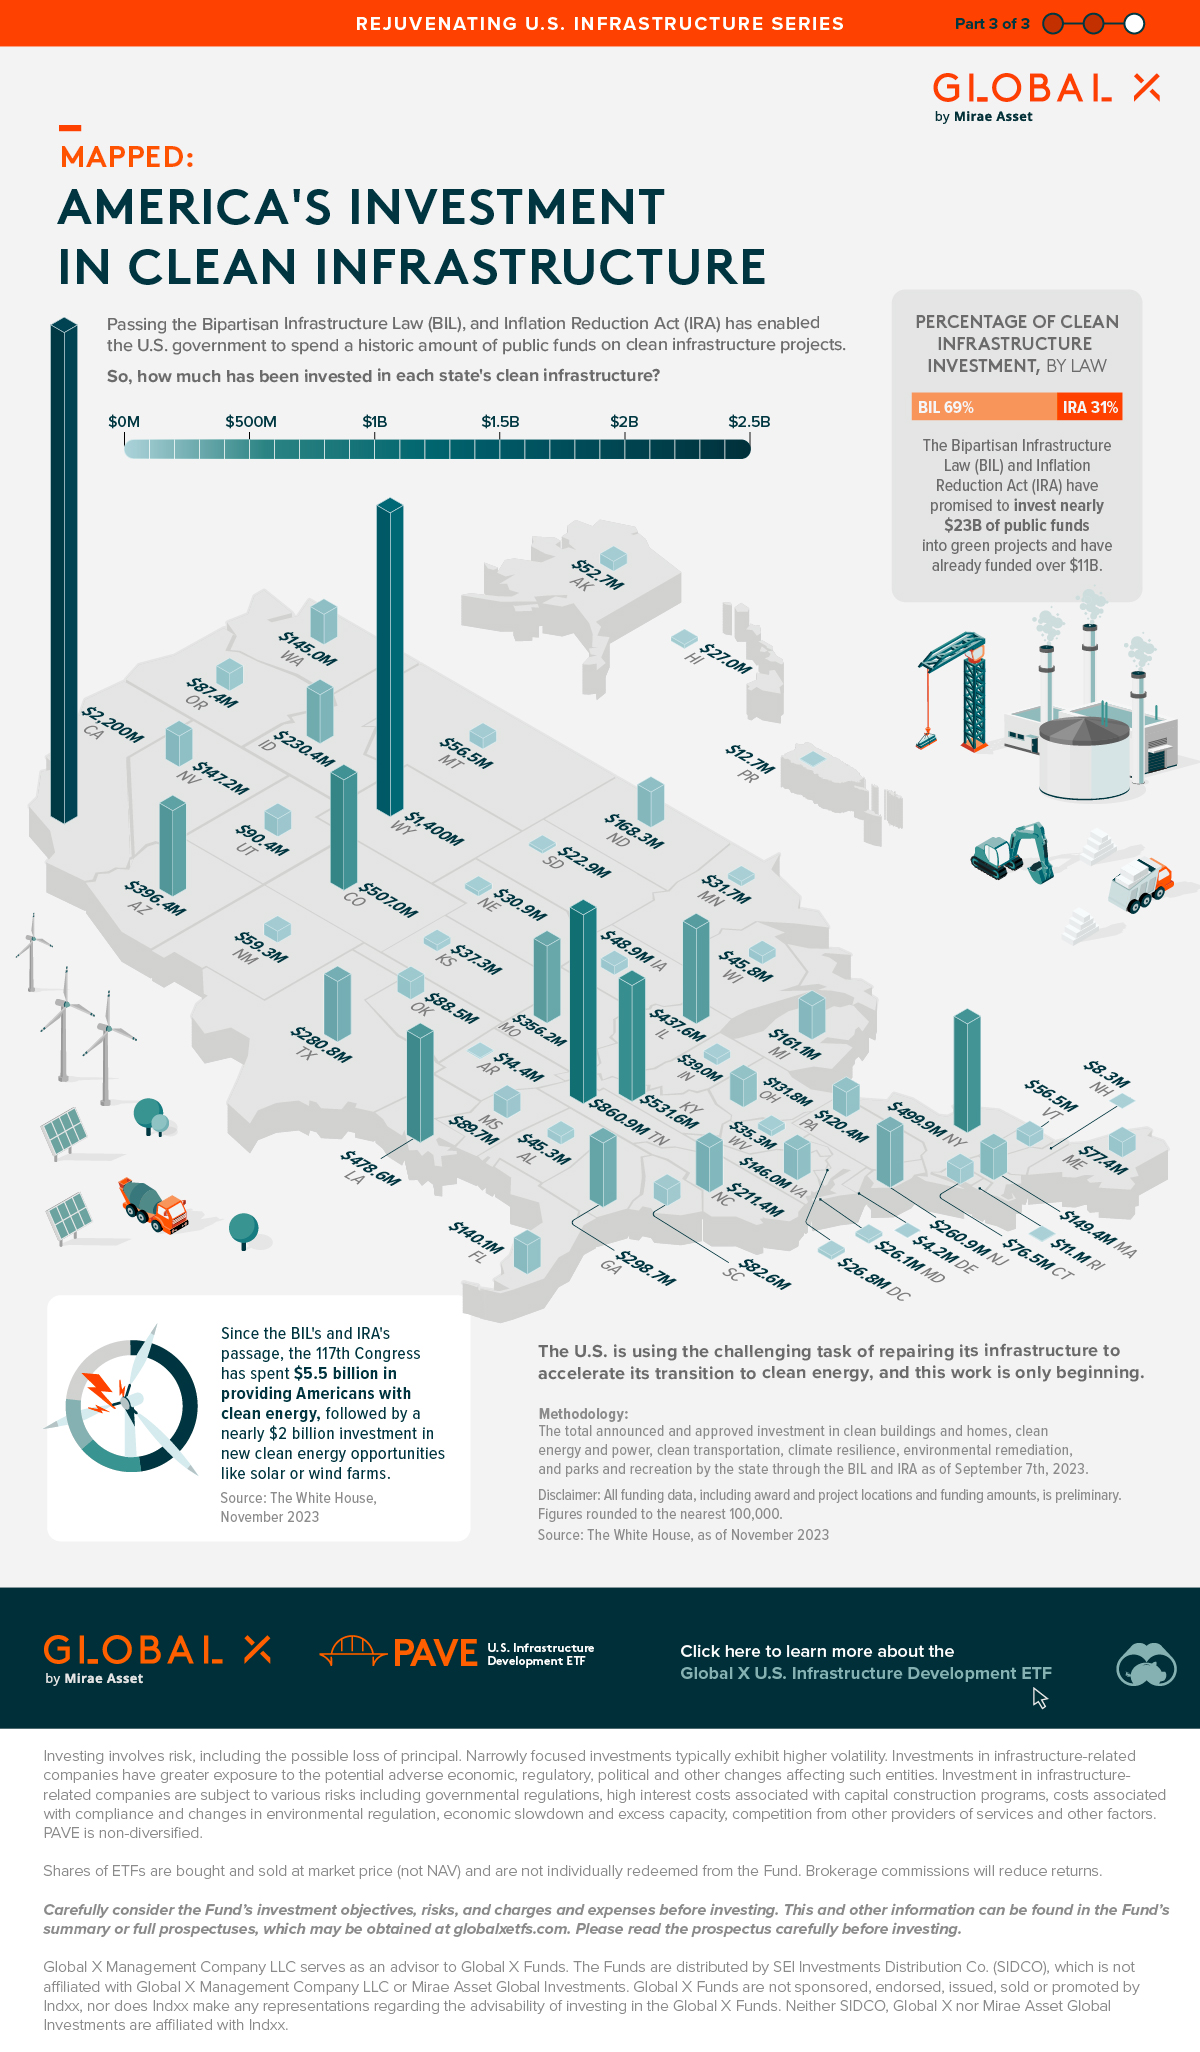
The U.S. is using its infrastructure renovation as an opportunity to invest heavily in sustainable infrastructure and accelerate its transition to clean energy.
Through the Bipartisan Infrastructure Law (BIL) and Inflation Reduction Act (IRA), the 117th Congress spent a historic amount of public funds on sustainable infrastructure projects.
So, for the final graphic in the Rejuavating U.S. Infrastructure series, we partnered with Global X ETFs to determine the amount invested in each state’s clean infrastructure so far.
Sustainable Infrastructure Investments Through the BIL and IRA
Sustainable infrastructure investment represents the total federal investment in various types of clean infrastructure. This includes clean buildings and homes, clean energy and power, clean transportation, climate resilience, environmental remediation, and parks and recreation.
This investment funds various activities, such as transforming an open field into a wind farm or providing cities with a fleet of new EV buses.
So, since passing the BIL and IRA in 2022, over $11.5 billion has been spent or allocated (as of November 2023) for clean energy and infrastructure. The breakdown of funds is as follows: 69% of the total comes from BIL, and 31% from the IRA.
Here is how funds have been divided by state so far:
| State | Investment | |||
|---|---|---|---|---|
| Alabama | $45,300,000 | |||
| Alaska | $52,700,000 | |||
| Arizona | $396,400,000 | |||
| Arkansas | $14,400,000 | |||
| California | $2,226,800,000 | |||
| Colorado | $507,000,000 | |||
| Connecticut | $76,500,000 | |||
| Delaware | $4,200,000 | |||
| District of Columbia | $26,800,000 | |||
| Florida | $140,100,000 | |||
| Georgia | $298,700,000 | |||
| Hawaii | $27,000,000 | |||
| Idaho | $230,400,000 | |||
| Illinois | $437,600,000 | |||
| Indiana | $39,000,000 | |||
| Iowa | $48,900,000 | |||
| Kansas | $37,300,000 | |||
| Kentucky | $531,600,000 | |||
| Louisiana | $478,600,000 | |||
| Maine | $77,400,000 | |||
| Maryland | $26,100,000 | |||
| Massachusetts | $149,400,000 | |||
| Michigan | $161,100,000 | |||
| Minnesota | $31,700,000 | |||
| Mississippi | $89,700,000 | |||
| Missouri | $356,200,000 | |||
| Montana | $56,500,000 | |||
| Nebraska | $30,900,000 | |||
| Nevada | $147,200,000 | |||
| New Hampshire | $8,300,000 | |||
| New Jersey | $260,900,000 | |||
| New Mexico | $59,300,000 | |||
| New York | $499,900,000 | |||
| North Carolina | $211,400,000 | |||
| North Dakota | $168,300,000 | |||
| Ohio | $131,800,000 | |||
| Oklahoma | $88,500,000 | |||
| Oregon | $87,400,000 | |||
| Pennsylvania | $120,400,000 | |||
| Puerto Rico | $12,700,000 | |||
| Rhode Island | $11,900,000 | |||
| South Carolina | $82,600,000 | |||
| South Dakota | $22,900,000 | |||
| Tennessee | $860,900,000 | |||
| Texas | $280,800,000 | |||
| Utah | $90,400,000 | |||
| Vermont | $56,500,000 | |||
| Virginia | $146,000,000 | |||
| Washington | $145,000,000 | |||
| West Virginia | $35,300,000 | |||
| Wisconsin | $45,800,000 | |||
| Wyoming | $1,379,900,000 |
Clean power has received the most investment, at 48%, followed by investments in new clean energy opportunities like solar or wind farms, at 16%.
Then, environmental remediation efforts like cleaning up oil spills or soil repair programs, sit at 13% of the total.
A Sustainable Future
Congress has already invested $11.5 billion in sustainable and clean infrastructure. But this is only half of the $23 billion the BIL and IRA have promised to provide over the next few years.
The promise of future investment is an excellent opportunity for the U.S. to accelerate its clean energy transition and rejuvenate its infrastructure.
This is the final part in the Rejuevenating U.S. Infrastructure series; be sure to to read parts one and two to learn why U.S. infrastructure required investment in the first place, and how much has been spent so far.
![]()
Click here to learn more about the Global X U.S. Infrastructure Development ETF.

Please enable JavaScript in your browser to complete this form.Enjoying the data visualization above? *Subscribe
Related Topics: #ira #infrastructure #energy transition #us map #u.s. map #globalx #infrastructure investment #BIL #clean investment
Click for Comments
var disqus_shortname = "visualcapitalist.disqus.com";
var disqus_title = "Mapped: U.S. Investment in Sustainable Infrastructure (2021-2023)";
var disqus_url = "https://www.visualcapitalist.com/sp/us-sustainable-infrastructure-investment/";
var disqus_identifier = "visualcapitalist.disqus.com-164034";
You may also like
-

Green25 mins ago
Chart: Is ESG Investing in Decline?
After the pandemic boom, ESG investments lost their luster amid high interest rates. Could they make a comeback?
-

Green3 days ago
Which Countries Have the Largest Forests?
Together, the top five countries with the largest forests account for more than half of the world’s entire forest cover.
-

Energy7 days ago
Visualizing All the Nuclear Waste in the World
Despite concerns about nuclear waste, high-level radioactive waste constitutes less than 0.25% of all radioactive waste ever generated.
-

Green2 weeks ago
Every EV Qualified for U.S. Tax Credits in 2024
The number of EVs eligible for U.S. tax credits dropped sharply in 2024. Here is every model that qualifies.
-

Green3 weeks ago
Visualizing the Top Global Risks in 2024
Here are global risk projections for 2024 as tensions in the Middle East escalate and major economies face elections this year.
-

Healthcare4 weeks ago
Visualized: What Lives in Your Gut Microbiome?
The human gut microbiome contains a world of microbes. We look at the the bacteria that deeply affect our health and well-being.
Subscribe
Please enable JavaScript in your browser to complete this form.Join the 375,000+ subscribers who receive our daily email *Sign Up
The post Mapped: U.S. Investment in Sustainable Infrastructure (2021-2023) appeared first on Visual Capitalist.