![]()
See more visualizations like this on the Voronoi app.
Use This Visualization
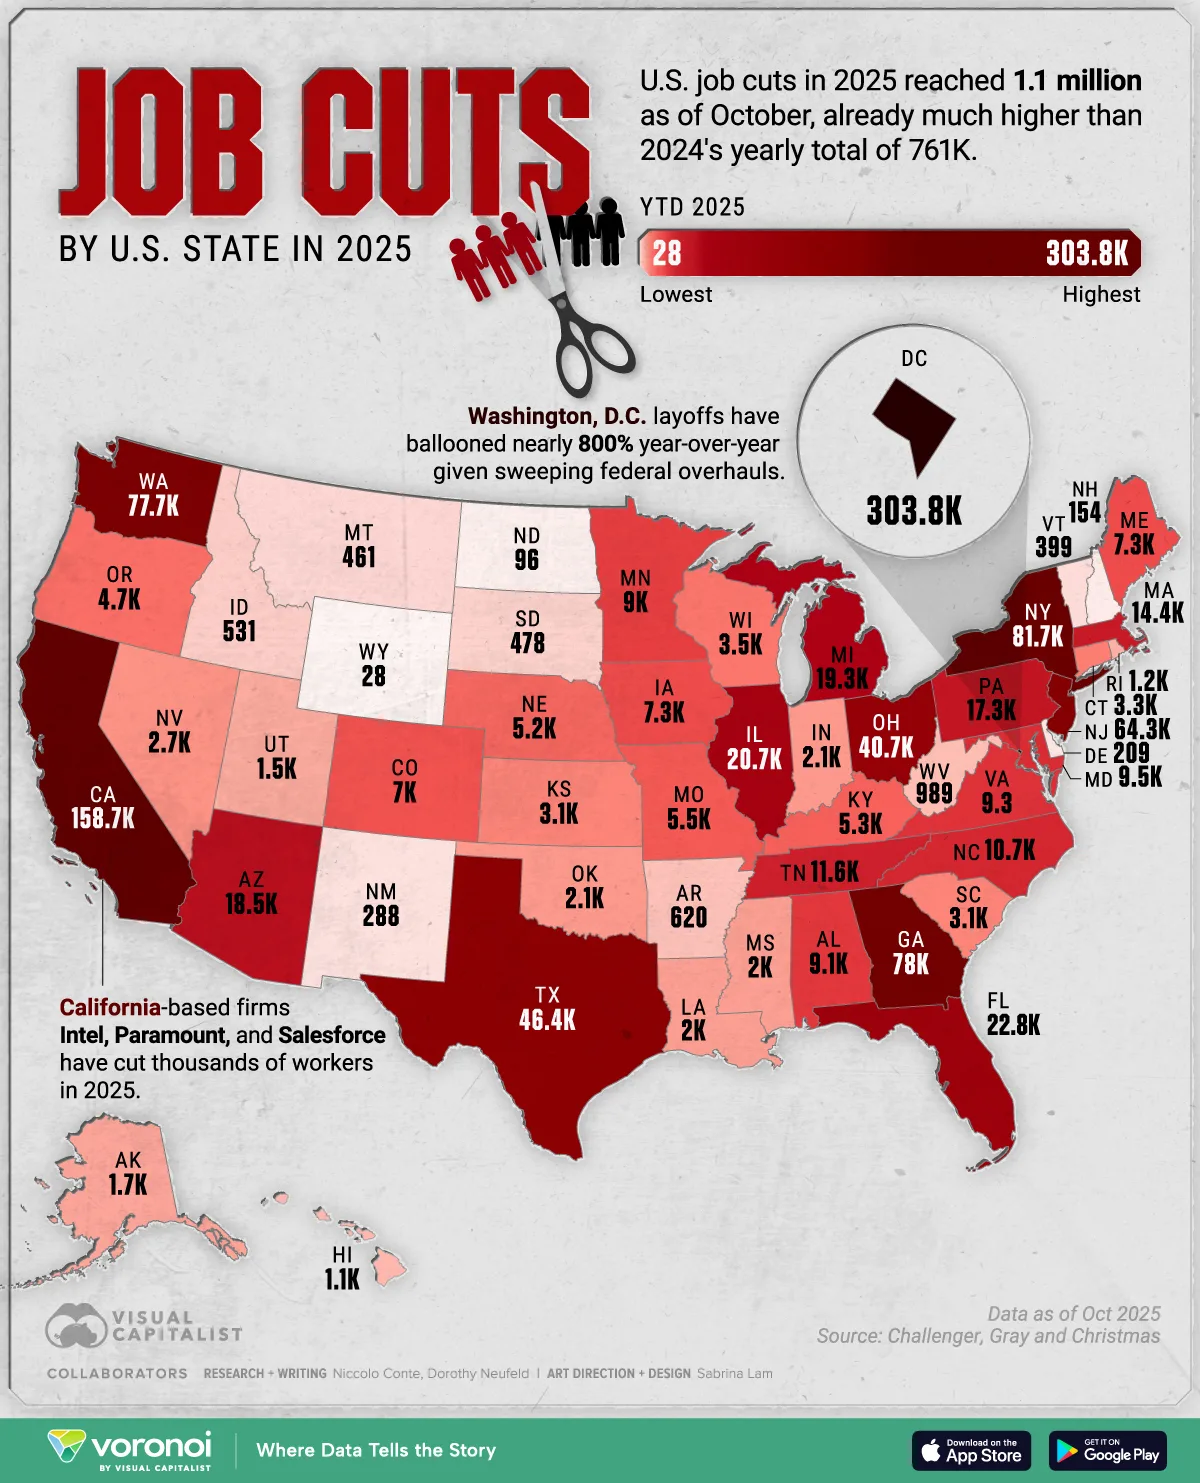
Mapped: Job Losses by U.S. State in 2025
See visuals like this from many other data creators on our Voronoi app. Download it for free on iOS or Android and discover incredible data-driven charts from a variety of trusted sources.
Key Takeaways
- Washington, D.C. is home to more than a quarter of the nation’s job losses in 2025, reaching 303,778 as of October.
- California accounts for 14% of U.S. layoffs, particularly in the tech and manufacturing sectors.
U.S. job weakness is disproportionately affecting certain states, as trade policy, immigration, and AI shapes the labor market.
So far, job losses in Washington, D.C. account for the largest share of the national total by far. California follows next in line, as Big Tech firms shed thousands of workers after a pandemic-era hiring spree.
This graphic shows job cuts by U.S. state in 2025, based on data from Challenger, Gray and Christmas.
U.S. Job Losses Hit 1.1 Million
This year, U.S. job losses have reached 1.1 million as of October, up sharply from last year’s total of 761,000.
| State | Job Losses YTD 2025 | Change vs YTD 2024 |
|---|---|---|
| Washington | 303,778 | 773% |
| California | 158,734 | 16% |
| New York | 81,701 | 20% |
| Georgia | 78,049 | 338% |
| Washington | 77,658 | 111% |
| New Jersey | 64,334 | 454% |
| Texas | 46,352 | -31% |
| Ohio | 40,707 | 70% |
| Florida | 22,771 | 76% |
| Illinois | 20,678 | 3% |
| Michigan | 19,336 | -10% |
| Arizona | 18,547 | 103% |
| Pennsylvania | 17,256 | 12% |
| Massachusetts | 14,430 | -18% |
| Tennessee | 11,566 | -27% |
| North Carolina | 10,720 | 26% |
| Maryland | 9,480 | 27% |
| Virginia | 9,304 | 32% |
| Alabama | 9,115 | 180% |
| Minnesota | 9,049 | 4% |
| Iowa | 7,318 | -8% |
| Maine | 7,311 | 1,446% |
| Colorado | 6,982 | -50% |
| Missouri | 5,519 | -21% |
| Kentucky | 5,277 | 52% |
| Nebraska | 5,249 | 597% |
| Oregon | 4,660 | -54% |
| Wisconsin | 3,511 | -63% |
| Connecticut | 3,251 | -66% |
| South Carolina | 3,136 | -28% |
| Kansas | 3,095 | -36% |
| Nevada | 2,668 | -76% |
| Indiana | 2,120 | -45% |
| Oklahoma | 2,061 | 124% |
| Louisiana | 2,050 | 57% |
| Mississippi | 2,006 | 95% |
| Alaska | 1,712 | 2,346% |
| Utah | 1,472 | -75% |
| Rhode Island | 1,221 | -90% |
| Hawaii | 1,063 | -65% |
| West Virginia | 989 | 1% |
| Arkansas | 620 | -63% |
| Idaho | 531 | -26% |
| South Dakota | 478 | -57% |
| Montana | 461 | -55% |
| Vermont | 399 | -15% |
| New Mexico | 288 | -68% |
| Delaware | 209 | -70% |
| New Hampshire | 154 | -35% |
| North Dakota | 96 | 3% |
| Wyoming | 28 | -99% |
As we can see, federal workforce overhauls have resulted in 303,778 layoffs in Washington, D.C., more than California and New York combined.
In California, job losses now total 158,734, reflecting a softening labor market. Overall, California is home to 18 million workers, the highest share in the country.
Across the broader U.S. tech sector, layoff announcements now total 141,159 compared with 120,470 this time last year. Notably, Intel plans to cut 5,000 workers in the U.S., mainly in California and Oregon. San Francisco-based Salesforce also plans to slash 4,000 workers this year.
Meanwhile, New York firms have cut 81,700 workers, a 20% increase from last year. New York-based Verizon alone announced cuts of 13,000 workers in November, largely affecting its U.S. employees.
By contrast, layoff data in Texas is significantly better in 2025 compared to a year ago. Not only that, it leads nationally in job creation, seeing some of the strongest growth in the services and hospitality sectors.
Learn More on the Voronoi App ![]()
To learn more about this topic, check out this graphic on unemployment by state.