![]()
See more visualizations like this on the Voronoi app.
Use This Visualization
Mapped: The Value of a College Degree by U.S. State
This was originally posted on our Voronoi app. Download the app for free on iOS or Android and discover incredible data-driven charts from a variety of trusted sources.
Key Takeaways
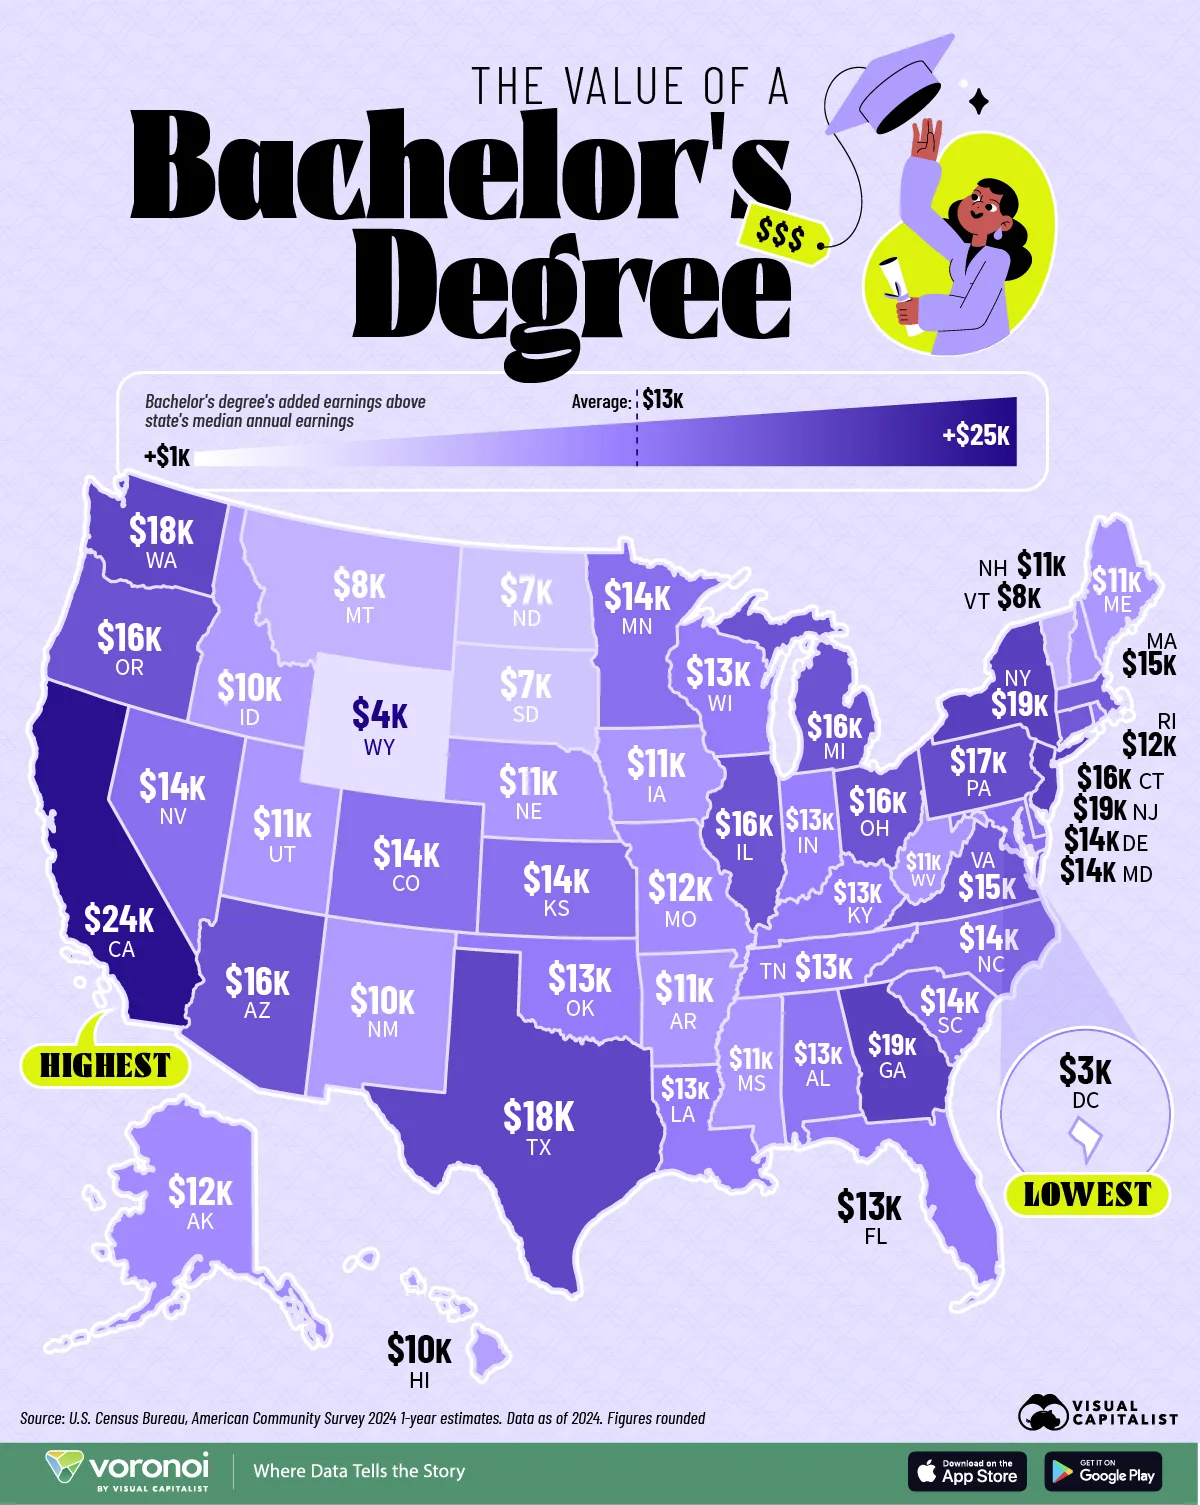
- The average value of a college degree (specifically, a bachelor’s degree) varies widely across the United States, from under $3,000 in Washington, D.C., to nearly $24,000 in California.
- On average across the country, a bachelor’s degree boosts income by around $13,000.
A college degree is often viewed as a lifelong investment, but the financial payoff of education depends heavily not only on what you study, but also on where you live.
This map uses data from the U.S. Census Bureau to visualize the value of a bachelor’s degree in each U.S. state, by comparing the median value of earnings of a bachelor’s degree holder to the median earnings of the average worker.
Where a Bachelor’s Degree Pays Off Most
In 2025, the nationwide median value added by a bachelor’s degree stands at roughly $13,000 per year, but the returns vary dramatically by state.
| Rank | State | Median earnings | Bachelor's degree added earnings | Median earnings with degree |
|---|---|---|---|---|
| 1 | California | $57,142 | $23,732 | $80,874 |
| 2 | Georgia | $51,472 | $19,110 | $70,582 |
| 3 | New York | $57,977 | $18,783 | $76,760 |
| 4 | New Jersey | $62,394 | $18,713 | $81,107 |
| 5 | Texas | $51,410 | $18,084 | $69,494 |
| 6 | Washington | $63,980 | $17,660 | $81,640 |
| 7 | Pennsylvania | $53,151 | $17,110 | $70,261 |
| 8 | Oregon | $53,070 | $16,492 | $69,562 |
| 9 | Illinois | $56,201 | $16,424 | $72,625 |
| 10 | Ohio | $51,357 | $16,234 | $67,591 |
| 11 | Connecticut | $62,042 | $15,837 | $77,879 |
| 12 | Arizona | $51,767 | $15,699 | $67,466 |
| 13 | Michigan | $50,867 | $15,630 | $66,497 |
| 14 | Virginia | $60,195 | $15,380 | $75,575 |
| 15 | Massachusetts | $66,968 | $14,816 | $81,784 |
| 16 | North Carolina | $50,858 | $14,312 | $65,170 |
| 17 | Nevada | $48,474 | $14,308 | $62,782 |
| 18 | Kansas | $51,227 | $14,307 | $65,534 |
| 19 | Delaware | $51,993 | $13,680 | $65,673 |
| 20 | South Carolina | $50,063 | $13,668 | $63,731 |
| 21 | Colorado | $61,975 | $13,662 | $75,637 |
| 22 | Maryland | $65,664 | $13,578 | $79,242 |
| 23 | Minnesota | $58,961 | $13,577 | $72,538 |
| 24 | Louisiana | $46,484 | $13,433 | $59,917 |
| 25 | Oklahoma | $46,800 | $13,206 | $60,006 |
| 26 | Kentucky | $47,730 | $13,124 | $60,854 |
| 27 | Wisconsin | $52,914 | $12,783 | $65,697 |
| 28 | Alabama | $48,522 | $12,661 | $61,183 |
| 29 | Tennessee | $50,054 | $12,600 | $62,654 |
| 30 | Indiana | $50,788 | $12,579 | $63,367 |
| 31 | Florida | $48,103 | $12,515 | $60,618 |
| 32 | Rhode Island | $57,276 | $12,220 | $69,496 |
| 33 | Alaska | $57,273 | $11,758 | $69,031 |
| 34 | Missouri | $50,341 | $11,750 | $62,091 |
| 35 | West Virginia | $45,847 | $11,120 | $56,967 |
| 36 | New Hampshire | $60,588 | $11,081 | $71,669 |
| 37 | Arkansas | $46,145 | $11,007 | $57,152 |
| 38 | Iowa | $51,293 | $10,951 | $62,244 |
| 39 | Nebraska | $51,347 | $10,674 | $62,021 |
| 40 | Maine | $51,823 | $10,619 | $62,442 |
| 41 | Utah | $54,701 | $10,598 | $65,299 |
| 42 | Mississippi | $44,889 | $10,592 | $55,481 |
| 43 | Hawaii | $52,534 | $10,435 | $62,969 |
| 44 | Idaho | $50,267 | $9,931 | $60,198 |
| 45 | New Mexico | $46,407 | $9,752 | $56,159 |
| 46 | Montana | $48,336 | $8,121 | $56,457 |
| 47 | Vermont | $54,378 | $7,571 | $61,949 |
| 48 | South Dakota | $50,954 | $7,253 | $58,207 |
| 49 | North Dakota | $53,510 | $7,050 | $60,560 |
| 50 | Wyoming | $50,162 | $4,051 | $54,213 |
| 51 | District of Columbia | $91,315 | $2,966 | $94,281 |
Graduates in California earn about $23,732 more than the average worker, the highest premium in the country. Other top states include Georgia ($19,110), New York ($18,783), and Texas ($18,084).
These states tend to have high concentrations of technology, finance, and professional service jobs, where educational credentials strongly influence pay scales.
Where the Degree Gap Is Smallest
At the opposite end, some states show little difference in earnings between college graduates and other workers.
In Washington, D.C., the average premium for a bachelor’s degree is just $3,000, largely because the city’s high baseline income raises wages across all occupations. In fact, bachelor’s degree holders in D.C. make the most nationwide—over $94,000 per year in median income—and the district also had the highest median household income in America in 2024.
Similarly, Wyoming, North Dakota, and South Dakota see premiums under $7,500, reflecting economies with strong blue-collar jobs that do not always require a degree.
Learn More on the Voronoi App ![]()
If you enjoyed today’s post, check out How Education Affects Earnings in Every State on Voronoi, the new app from Visual Capitalist.