
Published
20 mins ago
on
April 30, 2025
| 11 views
-->
By
Julia Wendling
Graphics & Design
- Jennifer West
The following content is sponsored by the Hinrich Foundation


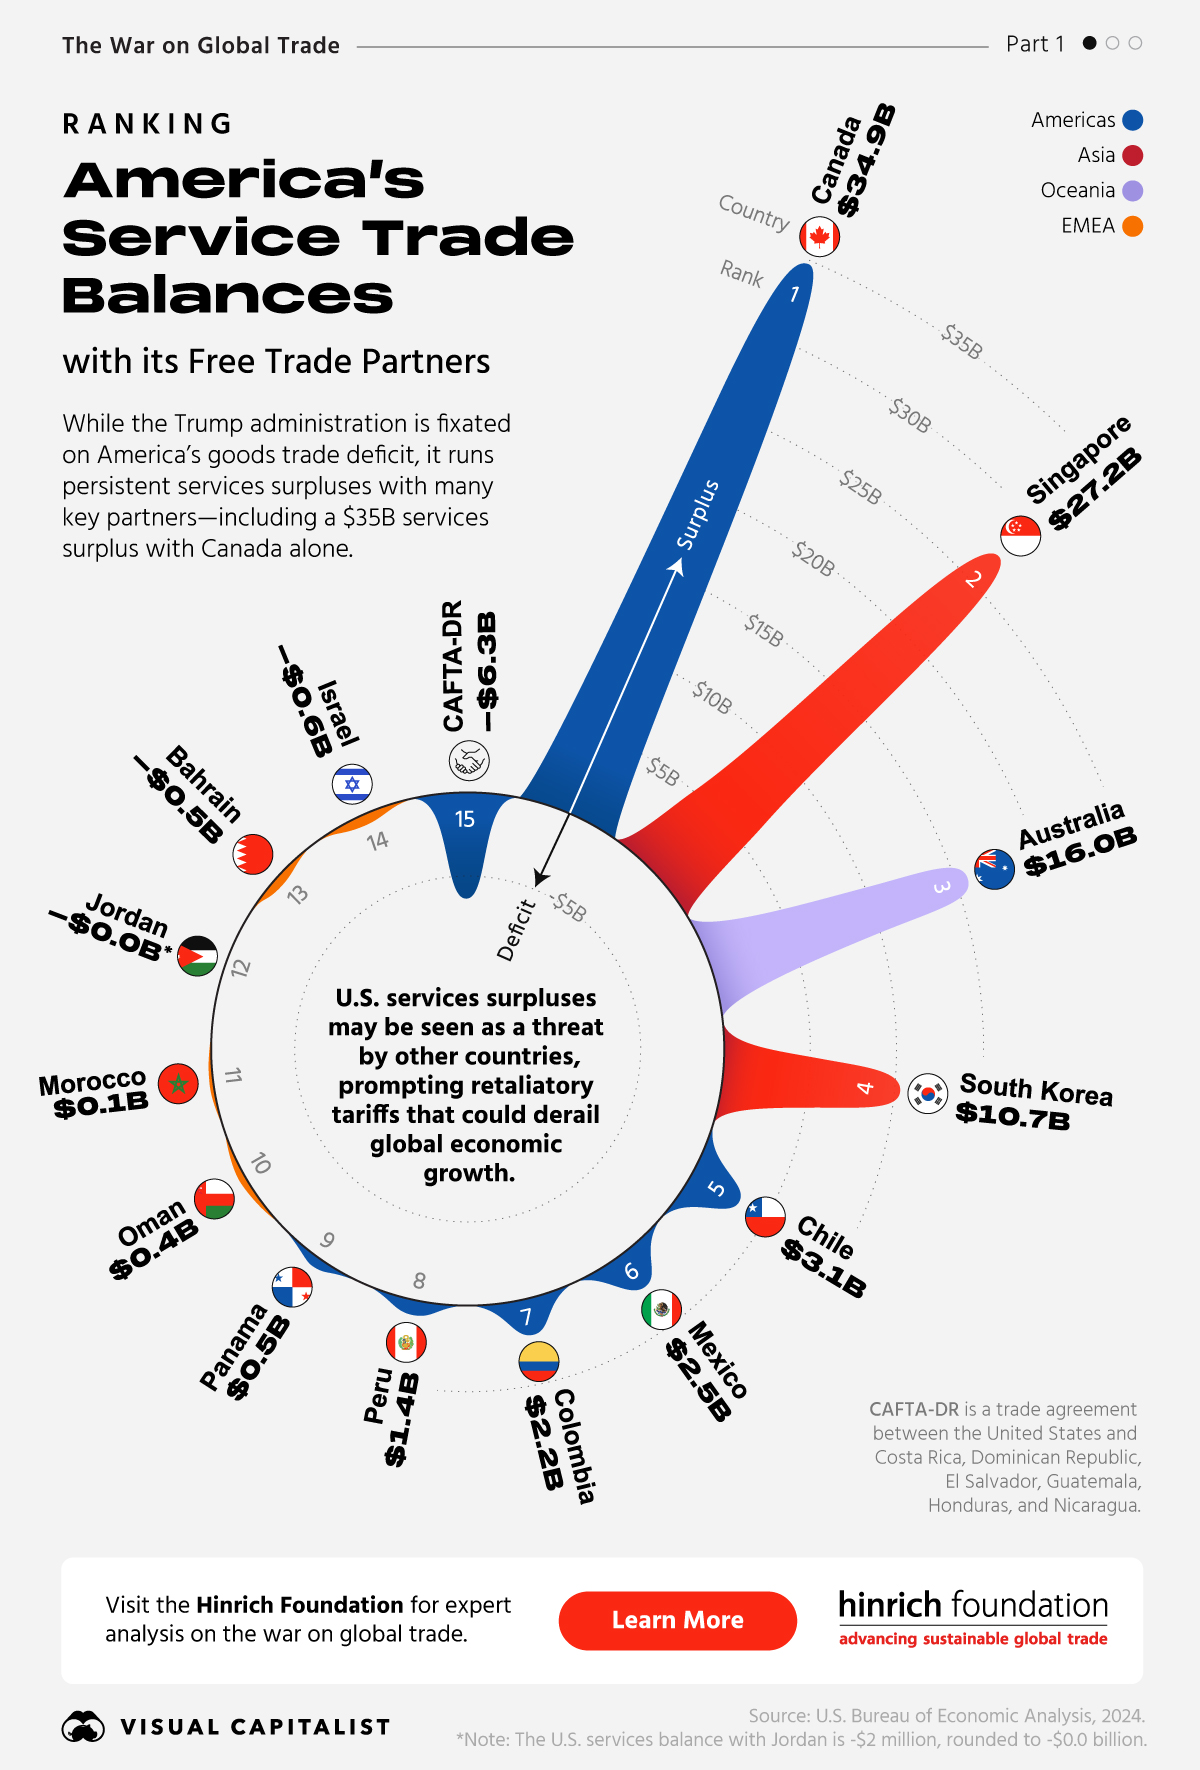
Ranked: America’s Services Trade Balances
America’s sizable goods trade deficits have dominated headlines lately, with Trump making them a cornerstone of his geopolitical agenda. Yet this narrow focus overlooks a critical part of the equation.
This visualization, created in partnership with the Hinrich Foundation, provides visual context to the substantial surpluses the U.S. earns from services, using data from the Bureau of Economic Analysis.
America’s Services Dominance
Before Trump’s second term, the U.S. had free trade agreements with 20 countries, including Canada and Mexico (through the USMCA), as well as Costa Rica, the Dominican Republic, Nicaragua, El Salvador, Honduras, and Guatemala (under CAFTA-DR), among others.
The U.S. maintains a consistent services surpluses with 16 of its 20 free trade partners (FTPs). The largest surpluses are with Canada ($34.9 billion), Singapore ($27.2 billion), Australia ($16.0 billion), South Korea ($10.7 billion), and Mexico ($2.5 billion).
| Country | Balance on goods and services ($B) | Balance on goods ($B) | Balance on services ($B) |
|---|---|---|---|
| Canada | -35.7 | -70.6 | +34.9 |
| Singapore | +30.1 | +3.0 | +27.2 |
| Australia | +33.8 | +17.8 | +16.0 |
| South Korea | -55.5 | -66.2 | +10.7 |
| Chile | +5.0 | +1.9 | +3.1 |
| Mexico | -179.0 | -181.5 | +2.5 |
| Colombia | +3.4 | +1.2 | +2.2 |
| Peru | +3.3 | +1.8 | +1.4 |
| Panama | +10.5 | +10.0 | +0.5 |
| Oman | +1.0 | +0.6 | +0.4 |
| Morocco | +3.6 | +3.5 | +0.1 |
| Jordan | -1.2 | -1.2 | -0.0 |
| Bahrain | -0.1 | +0.4 | -0.5 |
| Israel | -7.4 | -6.8 | -0.6 |
| CAFTA-DR countries | +3.7 | +10.0 | -6.3 |
| Total ($B) | -184.4 | -276.1 | +91.7 |
The top American service exports globally include travel, financial, and consulting services. The country also exports transportation and other personal services (such as health and education services).
The Big Picture
Even looking at the overall goods and services balance, the U.S. runs surpluses with many of its FTPs. Its largest surpluses are with Australia ($33.8 billion), Singapore ($30.1 billion), and Panama ($10.5 billion).
However, it does run some large deficits as well. The largest deficits are with Mexico (-$179.0 billion), South Korea (-$55.5 billion), and Canada (-$35.7 billion).
The War on Global Trade
America’s goods trade balance tells only half the story. If countries hit by Trump-era tariffs start viewing U.S. services surpluses as a national security concern, they could respond with retaliatory tariffs—posing serious risks to both U.S. and global economic growth.
Related Topics: #trade #trump #goods #tariffs #services #Hinrich Foundation #bea #hinrich
Click for Comments
var disqus_shortname = "visualcapitalist.disqus.com";
var disqus_title = "Ranked: America’s Services Trade Balances";
var disqus_url = "https://www.visualcapitalist.com/sp/ranked-americas-services-trade-balances/";
var disqus_identifier = "visualcapitalist.disqus.com-177399";
You may also like
-
Economy2 weeks ago
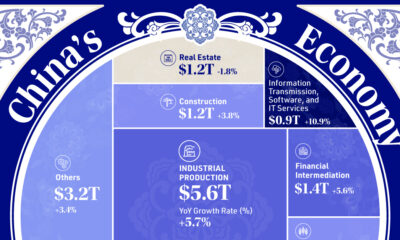
Visualizing China’s $18.6 Trillion Economy by Sector in 2024
China’s total GDP grew to $18.6 trillion in 2024, hitting the government’s official target of “around 5%”.
-
United States2 months ago
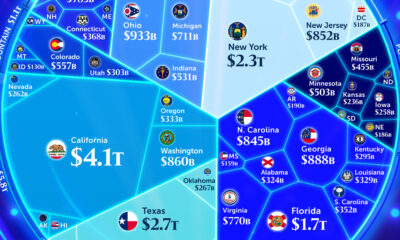
Visualizing America’s $29 Trillion Economy by State
Which states contribute the most to the U.S. economy? This graphic breaks down the country’s GDP by state, including overseas activity.
-
Economy3 months ago
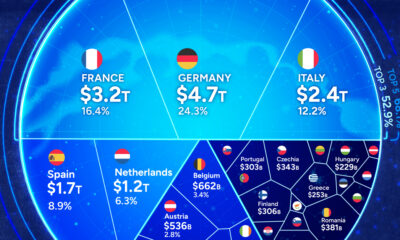
Visualizing the European Union’s $19 Trillion Economy
The three biggest EU economies–Germany, France, and Italy–account for over half of the EU’s $19.4 trillion GDP.
-

Economy3 months ago
Which Chinese Products Are Most Exposed to U.S. Tariffs?
Representing $96 billion in China’s exports to the U.S., consumer electronics is most vulnerable industry to proposed U.S. tariffs on China.
-
Economy7 months ago
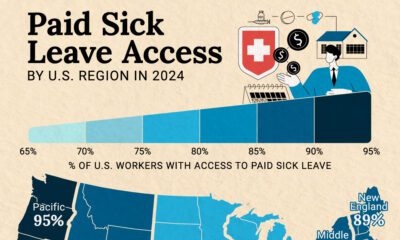
Mapped: Paid Sick Leave Access by U.S. Region
This map shows which U.S. regions’ workers have the highest access to paid sick leave in 2024, using data from the Bureau of Labor Statistics.
-
Economy8 months ago
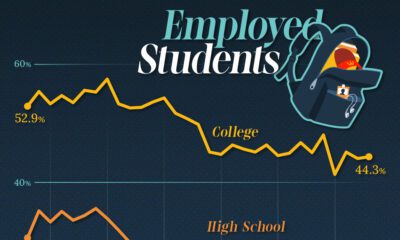
U.S. High School and College Student Employment Rates (1993–2023)
This graphic shows U.S. high school and college student employment from 1993 to 2023, based on data from the U.S. Bureau of Labor Statistics.
Subscribe
Please enable JavaScript in your browser to complete this form.Join the 375,000+ subscribers who receive our daily email *Sign Up