![]()
See more visuals like this on the Voronoi app.
Use This Visualization
Ranked: Cities Where Young Americans Can Still Afford a Home
See visuals like this from many other data creators on our Voronoi app. Download it for free on iOS or Android and discover incredible data-driven charts from a variety of trusted sources.
Key Takeaways
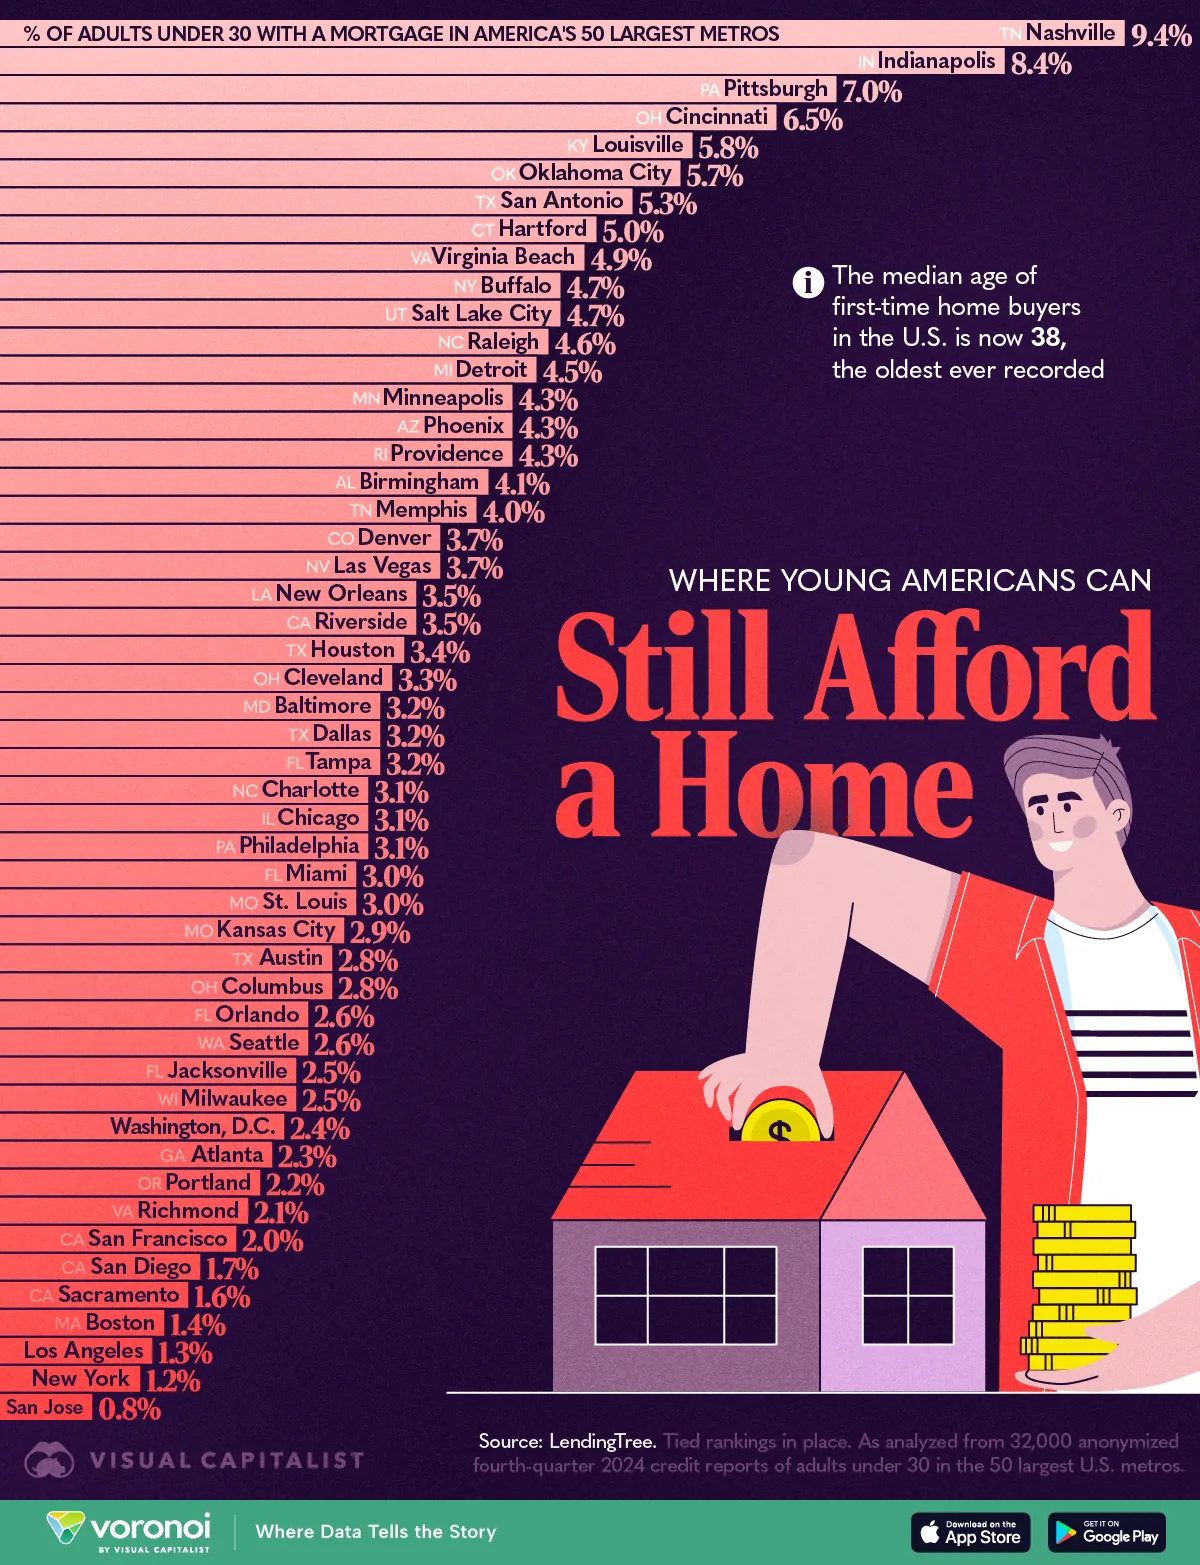
- Nearly 10% of Nashville’s residents below the age of 30 hold a mortgage, according to LendingTree’s analysis of 2024 credit reports.
- Among the 50 largest metros, this is the highest share of adults under 30 with mortgages, suggesting it’s the best city for young Americans to afford a home.
We rank the 50 largest U.S. metropolitan areas by the share of adults under 30 who have a mortgage, painting a clear picture of where today’s twentysomethings can realistically afford a home.
Data for this visualization comes from LendingTree. They analyzed 32,000 anonymized fourth-quarter 2024 credit reports of adults under 30 in the 50 largest U.S. metros to create this ranking. Please see their methodology section for more details.
The American Dream is Still Within Reach In These Cities
At 9.4%, Nashville claims the highest share of under-30 mortgage holders in the country.
| Rank | City | State | Share of Americans Under 30 With Mortgages |
|---|---|---|---|
| 1 | Nashville | Tennessee | 9.4% |
| 2 | Indianapolis | Indiana | 8.4% |
| 3 | Pittsburgh | Pennsylvania | 7.0% |
| 4 | Cincinnati | Ohio | 6.5% |
| 5 | Louisville | Kentucky | 5.8% |
| 6 | Oklahoma City | Oklahoma | 5.7% |
| 7 | San Antonio | Texas | 5.3% |
| 8 | Hartford | Connecticut | 5.0% |
| 9 | Virginia Beach | Virginia | 4.9% |
| 10 | Buffalo | New York | 4.7% |
| 10 | Salt Lake City | Utah | 4.7% |
| 12 | Raleigh | North Carolina | 4.6% |
| 13 | Detroit | Michigan | 4.5% |
| 14 | Minneapolis | Minnesota | 4.3% |
| 14 | Phoenix | Arizona | 4.3% |
| 14 | Providence | Rhode Island | 4.3% |
| 17 | Birmingham | Alabama | 4.1% |
| 18 | Memphis | Tennessee | 4.0% |
| 19 | Denver | Colorado | 3.7% |
| 19 | Las Vegas | Nevada | 3.7% |
| 21 | New Orleans | Louisiana | 3.5% |
| 21 | Riverside | California | 3.5% |
| 23 | Houston | Texas | 3.4% |
| 24 | Cleveland | Ohio | 3.3% |
| 25 | Baltimore | Maryland | 3.2% |
| 25 | Dallas | Texas | 3.2% |
| 25 | Tampa | Florida | 3.2% |
| 28 | Charlotte | North Carolina | 3.1% |
| 28 | Chicago | Illinois | 3.1% |
| 28 | Philadelphia | Pennsylvania | 3.1% |
| 31 | Miami | Florida | 3.0% |
| 31 | St. Louis | Missouri | 3.0% |
| 33 | Kansas City | Missouri | 2.9% |
| 34 | Austin | Texas | 2.8% |
| 34 | Columbus | Ohio | 2.8% |
| 36 | Orlando | Florida | 2.6% |
| 36 | Seattle | Washington | 2.6% |
| 38 | Jacksonville | Florida | 2.5% |
| 38 | Milwaukee | Wisconsin | 2.5% |
| 40 | Washington, D.C. | District of Columbia | 2.4% |
| 41 | Atlanta | Georgia | 2.3% |
| 42 | Portland | Oregon | 2.2% |
| 43 | Richmond | Virginia | 2.1% |
| 44 | San Francisco | California | 2.0% |
| 45 | San Diego | California | 1.7% |
| 46 | Sacramento | California | 1.6% |
| 47 | Boston | Massachusetts | 1.4% |
| 48 | Los Angeles | California | 1.3% |
| 49 | New York | New York | 1.2% |
| 50 | San Jose | California | 0.8% |
The Music City’s housing-price growth has slowed from its pandemic peak, and a steady influx of jobs in healthcare, tech, and entertainment is giving young workers both stable incomes and loan approval power.
Indianapolis (8.4%) and Pittsburgh (7.0%) follow, proof that mid-sized metros with diversified economies and moderate price tags remain happy hunting grounds for first-time buyers.
These leaders share several traits: median home prices well below the national average, shorter commute times that widen the geographic radius of affordable neighborhoods, and state-level programs that reduce down-payment hurdles.
Related: Here’s the latest median home prices by state.
Midwest Cities and South Dominate Home Affordability
Beyond the top three, the next dozen cities are heavily concentrated in the Midwest and South.
Cincinnati, Louisville, Oklahoma City, and San Antonio all break the 5% threshold.
Lower land costs and more flexible zoning keep construction pipelines open, while relatively low student-debt balances reduce the debt-to-income ratios that lenders scrutinize.
Related: See how Ohio, Kentucky, Texas, and Oklahoma perform on average student debt by state.
Even mid-tier Rust Belt metros such as Detroit (4.5%) and Minneapolis (4.3%) do better than larger coastal cities.
Their affordable starter-home inventories help offset slower wage growth. This illustrates that absolute price matters more than headline salary figures when it comes to qualifying for a mortgage before age 30.
Coastal State Economies Are Punishing for Home Ownership
At the other end of the spectrum stand San Jose (0.8%), New York City (1.2%), and Los Angeles (1.3%).
Sky-high property values inflate required down payments to six figures, while stricter land-use rules limit new supply and keep entry-level stock scarce.
Even Boston (1.4%) and Seattle (2.6%), cities with strong job markets, show that surging demand can overwhelm wage gains. This can and push homeownership beyond the reach of many young professionals.
Related: The median age of first-time home buyers in the U.S. is now 38, the oldest ever recorded.
Learn More on the Voronoi App ![]()
For a broarder perspective, check out: Where Homes are Affordable in North America Voronoi, the new app from Visual Capitalist.