Published
7 mins ago
on
August 27, 2025
| 10 views
-->
By
Julia Wendling
Graphics & Design
- Athul Alexander
Ranked: The Most Expensive U.S. Wildfire Events, So Far
Wildfire events are growing increasingly frequent and destructive around the world as human-driven climate impacts continue to escalate—and the United States is no exception.
In collaboration with Inigo Insurance, this visual explores the most expensive wildfires in U.S. history to date, using data from the National Centers for Environmental Information to provide crucial context around their financial toll.
Wildfires & Climate Change
According to NASA, extreme wildfire activity has more than doubled globally over the past two decades. Fire seasons are not only growing longer, but off-season wildfires are also becoming increasingly common. A striking example is the Marshall Fire, which erupted in Colorado during the winter of 2021 and went on to become the state’s most costly wildfire on record.
At the same time, wildfire-related emissions are surging. Between 2001 and 2023, NASA researchers observed a 60% rise in carbon emissions from forest fires.
While wildfires are a natural part of many ecosystems, the growing intensity and frequency of fires—amplified by a warming climate—are raising serious environmental concerns.
California Wildfires
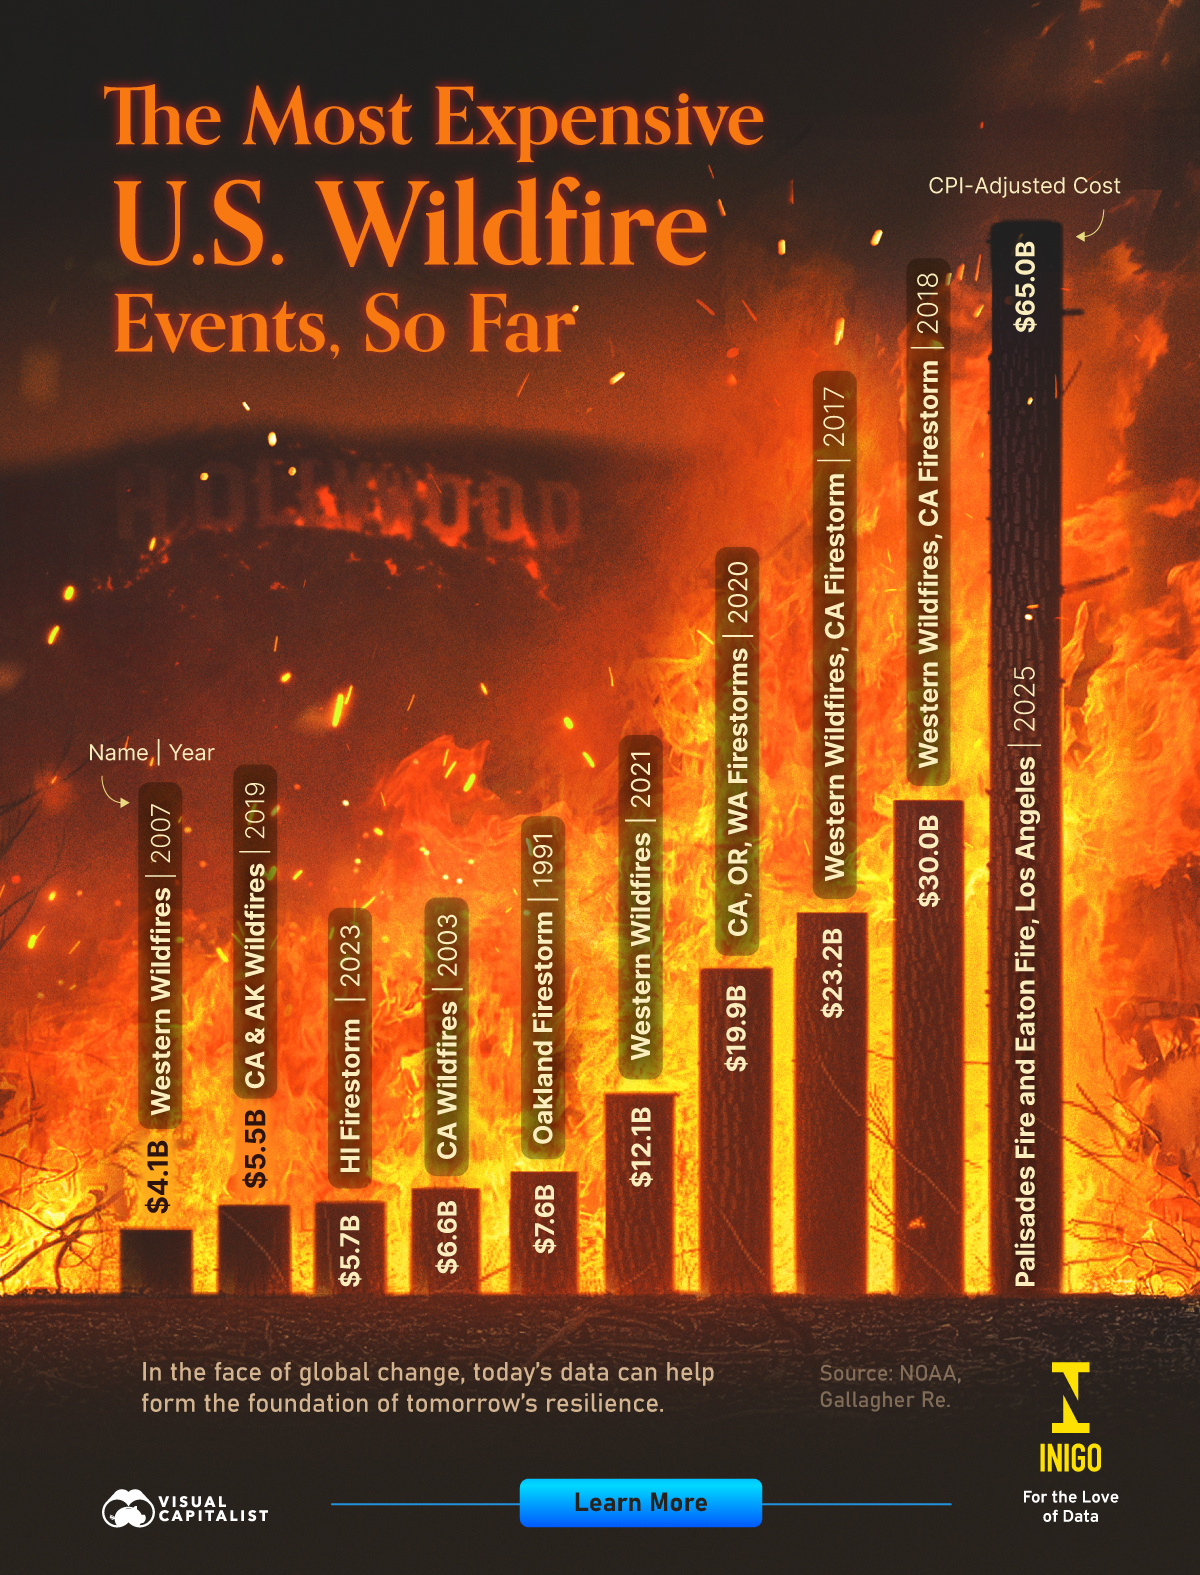
California and its neighboring Western states have been the epicenter of many of the most financially devastating wildfires in U.S. history. At the top of the list are the January 2025 Pacific Palisades and Eaton Fires, which together caused an unprecedented $65.0 billion in damage.
| Name | Begin Date | CPI-Adjusted Cost ($ billions) |
|---|---|---|
| Palisades Fire and Eaton Fire, Los Angeles | January 2025 | 65.0 |
| Western Wildfires, California Firestorm | June 2018 | 30.0 |
| Western Wildfires, California Firestorm | June 2017 | 23.2 |
| Western Wildfires - California, Oregon, Washington Firestorms | August 2020 | 19.9 |
| Western Wildfires | June 2021 | 12.1 |
| Oakland Firestorm | Oct 1991 | 7.6 |
| California Wildfires | Sept 2003 | 6.6 |
| Hawaii Firestorm | August 2023 | 5.7 |
| California and Alaska Wildfires | June 2019 | 5.5 |
| Western Wildfires | June 2007 | 4.1 |
Next are three other major California wildfires: the June 2018 fires ($30.0 billion), June 2017 fires ($23.2 billion), and August 2020 fires ($19.9 billion), which also extended into Oregon and Washington. Each of these events inflicted tens of billions of dollars in destruction.
In fact, 9 of the 10 most expensive wildfires on record occurred in California and other Western states, underscoring the region’s heightened vulnerability to extreme fire events.
A Future of Fires
As climate change continues to accelerate, extreme weather events—including wildfires—are expected to remain a persistent threat. The rising toll in both frequency and financial damage highlights the critical importance of fire preparedness and securing adequate insurance coverage.
![]()
Explore Inigo’s Hub.
You may also like
-
Environment4 weeks ago
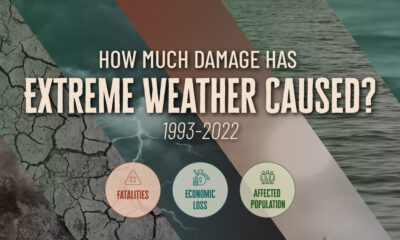
Charted: The Cost of Extreme Weather (1993-2022)
Extreme weather has cost over $4 trillion and taken hundreds of thousands of lives over 30 years. See the latest data here.
-
Environment2 months ago
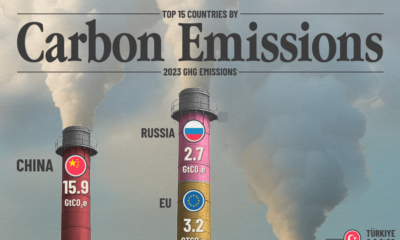
Ranked: Top 15 Countries by Carbon Emissions
This graphic is a revamped look at the top 15 countries by carbon emissions in 2023, visually comparing them to each other for better insights.
-
Environment2 months ago
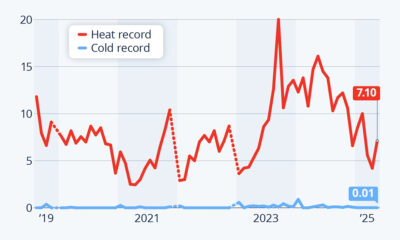
How Much of Earth Is Hitting Record Temperatures?
Over 7% of Earth’s surface set new heat records in May 2025, continuing a trend of more extreme temperatures.
-
Environment2 months ago
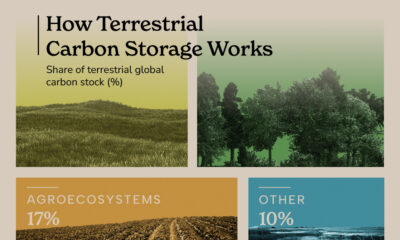
Infographic: How Terrestrial Carbon Storage Works
Discover how terrestrial carbon storage works and which ecosystems hold the most carbon, from forests to grasslands
-
Environment8 months ago
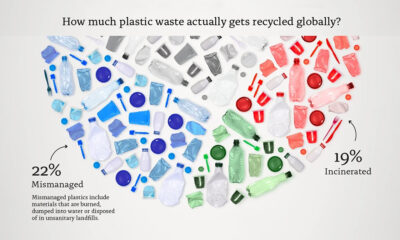
How Much of the World’s Plastic Waste Actually Gets Recycled?
This chart breaks down plastic waste disposal, showing just how little recycling is happening at the global level.
-

Environment9 months ago
Charted: Per-Capita CO2 Emissions by Global Region (1960-2022)
This infographic shows how per-capita CO2 emissions have changed across the world’s seven major regions.
Subscribe
Please enable JavaScript in your browser to complete this form.Join the 375,000+ subscribers who receive our daily email *Sign Up