![]()
See more visuals like this on the Voronoi app.
Use This Visualization
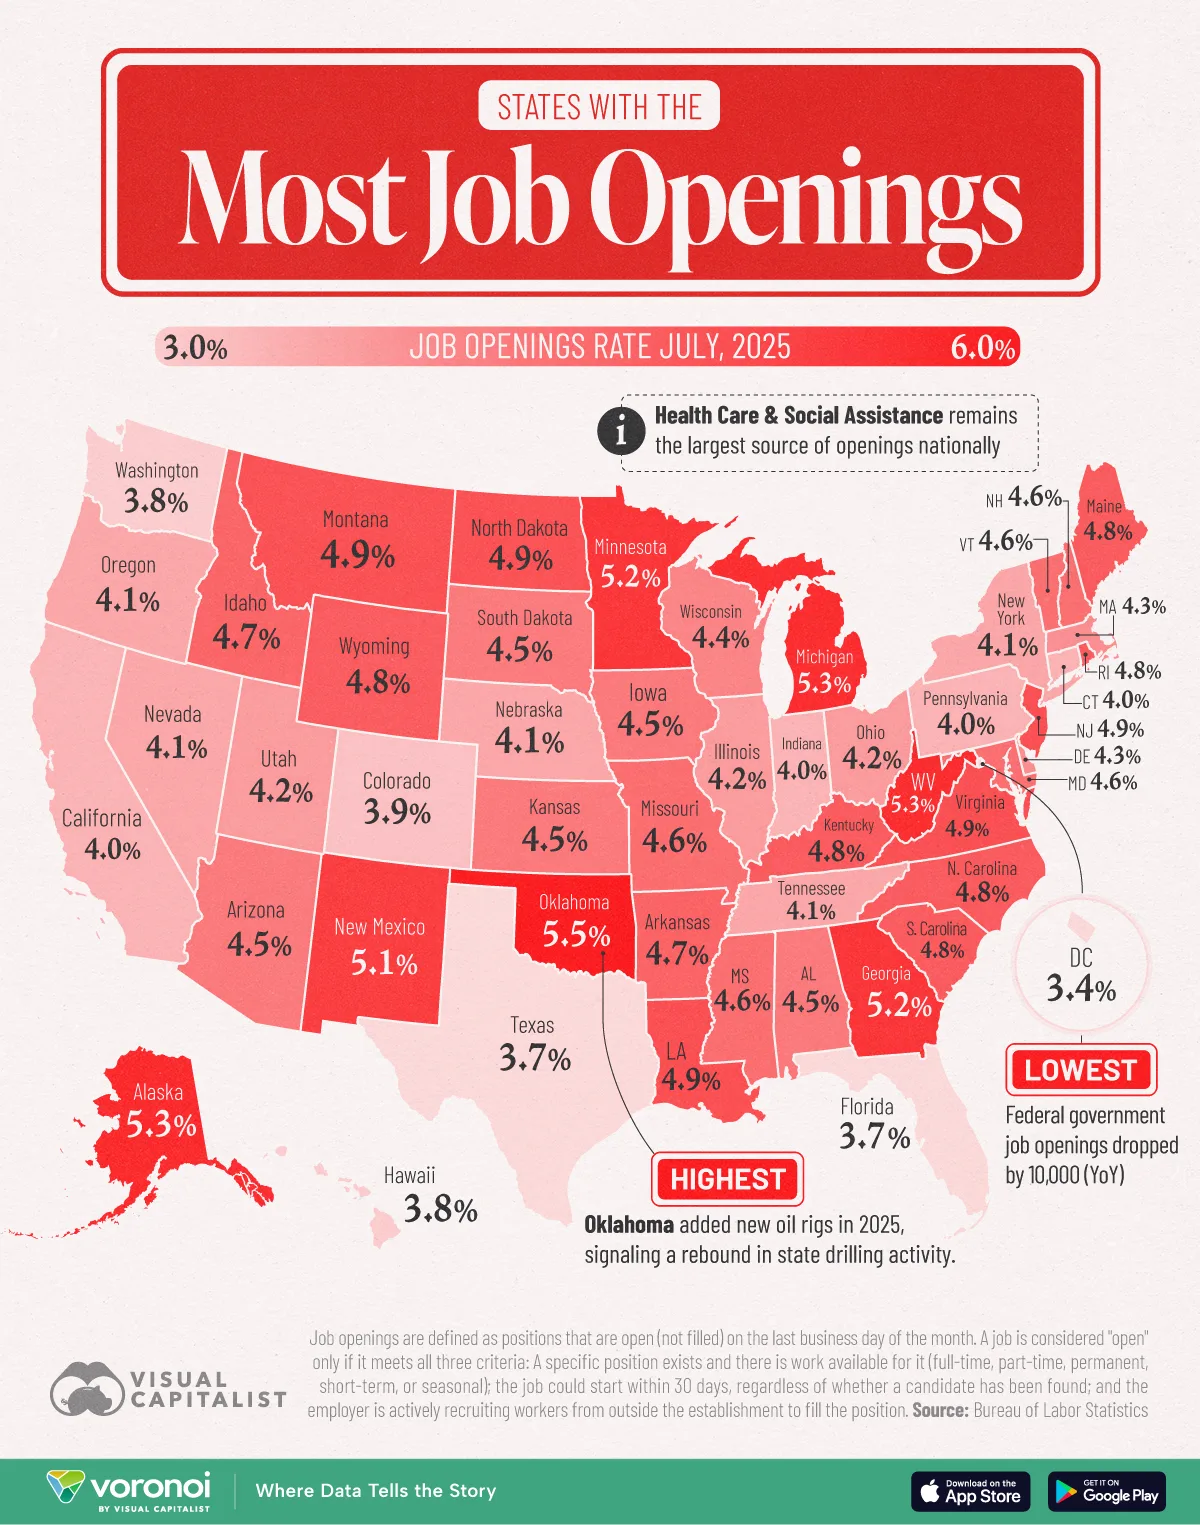
Ranked: States With the Most Job Openings in 2025
See visuals like this from many other data creators on our Voronoi app. Download it for free on iOS or Android and discover incredible data-driven charts from a variety of trusted sources.
Key Takeaways
- Oklahoma tops the states with the most job openings, (5.5%), buoyed by a rebound in energy drilling.
- Midwest and Southern “Battery Belt” states report elevated openings, reflecting hard-to-fill skilled roles more than a broad hiring boom.
America’s unemployment rate has officially risen higher than the number of job openings in the country for the first time since the end of the pandemic.
But there are pockets still hiring.
The chart below ranks states by their 2025 job-opening rates using data for this visualization comes from U.S. Bureau of Labor Statistics.
It measures the percentage of all filled and unfilled positions that remain vacant at the end of the month, along with pure counts of openings.
A job is considered “open” only if it meets all three criteria:
i. A specific position exists and there is work available for it (full-time, part-time, permanent, short-term, or seasonal).
ii. The job could start within 30 days, regardless of whether a candidate has been found.
iii. The employer is actively recruiting workers from outside the establishment to fill the position. Active recruiting can include advertising, interviewing, contacting employment agencies, or other recruiting activities.
Oklahoma’s Job Market Is Still Tight
At 5.5%, Oklahoma tops the nation’s vacancy rate, edging out perennial labor-short Alaska.
| Rank | State | State Code | Job Openings Rate | # of Job Openings (thousands) |
|---|---|---|---|---|
| 1 | Oklahoma | OK | 5.5% | 104 |
| 2 | Alaska | AK | 5.3% | 19 |
| 3 | Michigan | MI | 5.3% | 253 |
| 4 | West Virginia | WV | 5.3% | 40 |
| 5 | Georgia | GA | 5.2% | 273 |
| 6 | Minnesota | MN | 5.2% | 167 |
| 7 | New Mexico | NM | 5.1% | 49 |
| 8 | Louisiana | LA | 4.9% | 103 |
| 9 | Montana | MT | 4.9% | 27 |
| 10 | New Jersey | NJ | 4.9% | 226 |
| 11 | North Dakota | ND | 4.9% | 23 |
| 12 | Virginia | VA | 4.9% | 220 |
| 13 | Kentucky | KY | 4.8% | 103 |
| 14 | Maine | ME | 4.8% | 33 |
| 15 | North Carolina | NC | 4.8% | 257 |
| 16 | Rhode Island | RI | 4.8% | 26 |
| 17 | South Carolina | SC | 4.8% | 123 |
| 18 | Wyoming | WY | 4.8% | 15 |
| 19 | Arkansas | AR | 4.7% | 68 |
| 20 | Idaho | ID | 4.7% | 44 |
| 21 | Maryland | MD | 4.6% | 137 |
| 22 | Mississippi | MS | 4.6% | 58 |
| 23 | Missouri | MO | 4.6% | 145 |
| 24 | New Hampshire | NH | 4.6% | 34 |
| 25 | Vermont | VT | 4.6% | 15 |
| 26 | Alabama | AL | 4.5% | 105 |
| 27 | Arizona | AZ | 4.5% | 153 |
| 28 | Iowa | IA | 4.5% | 75 |
| 29 | Kansas | KS | 4.5% | 69 |
| 30 | South Dakota | SD | 4.5% | 22 |
| 31 | Wisconsin | WI | 4.4% | 140 |
| 32 | Delaware | DE | 4.3% | 22 |
| 33 | Massachusetts | MA | 4.3% | 169 |
| 34 | Illinois | IL | 4.2% | 272 |
| 35 | Ohio | OH | 4.2% | 253 |
| 36 | Utah | UT | 4.2% | 78 |
| 37 | Nebraska | NE | 4.1% | 46 |
| 38 | Nevada | NV | 4.1% | 67 |
| 39 | New York | NY | 4.1% | 426 |
| 40 | Oregon | OR | 4.1% | 86 |
| 41 | Tennessee | TN | 4.1% | 145 |
| 42 | California | CA | 4.0% | 757 |
| 43 | Connecticut | CT | 4.0% | 71 |
| 44 | Indiana | IN | 4.0% | 137 |
| 45 | Pennsylvania | PA | 4.0% | 261 |
| 46 | Colorado | CO | 3.9% | 121 |
| 47 | Hawaii | HI | 3.8% | 26 |
| 48 | Washington | WA | 3.8% | 146 |
| 49 | Florida | FL | 3.7% | 391 |
| 50 | Texas | TX | 3.7% | 554 |
| 51 | District of Columbia | DC | 3.4% | 27 |
| 52 | U.S. Total | USA | 4.3% | 7,181 |
A brisk rebound in crude-oil prices has re-activated rigs in the Anadarko Basin, creating demand for drillers, field engineers, and support staff.
At the same time, robust logistics hiring around Oklahoma City and Tulsa is soaking up additional workers, leaving employers scrambling to backfill positions.
Battery Belt States Struggle to Fill Skilled Roles
Michigan, Georgia, Kentucky, and the Carolinas each show job-opening rates near or above 5%.
These states sit inside what analysts dub the “Battery Belt,” a manufacturing corridor attracting billions in EV and battery investments.
While capital spending is high, many of the advertised roles require mechatronics, advanced welding, or high-voltage maintenance skills. The state talent pools that are still catching up to industrial demand.
As a result, churn and prolonged searches are inflating vacancy rates rather than signaling runaway hiring.
Related: Take a look at the investments required to meet battery demand by 2040.
Large Coastal Economies Cool, but Vacancies Persist
California and Texas—America’s two largest labor markets—display lower vacancy rates (4.0% and 3.7% respectively) but still account for more than 1.3 million combined openings.
These figures show that even marginally softer coast-to-coast demand translates into huge absolute gaps in staffing.
Meanwhile, D.C.’s lowest job opening rate is a reflection of the churn in the federal workforce. For reference, federal government job openings dropped by 10,000 year-over-year.
Learn More on the Voronoi App ![]()
If you enjoyed today’s post, check out the largest labor forces by country on Voronoi, the new app from Visual Capitalist.