![]()
See this visualization first on the Voronoi app.
Use This Visualization
Ranked: States Where Americans Have the Most Cash
This was originally posted on our Voronoi app. Download the app for free on iOS or Android and discover incredible data-driven charts from a variety of trusted sources.
Key Takeaways
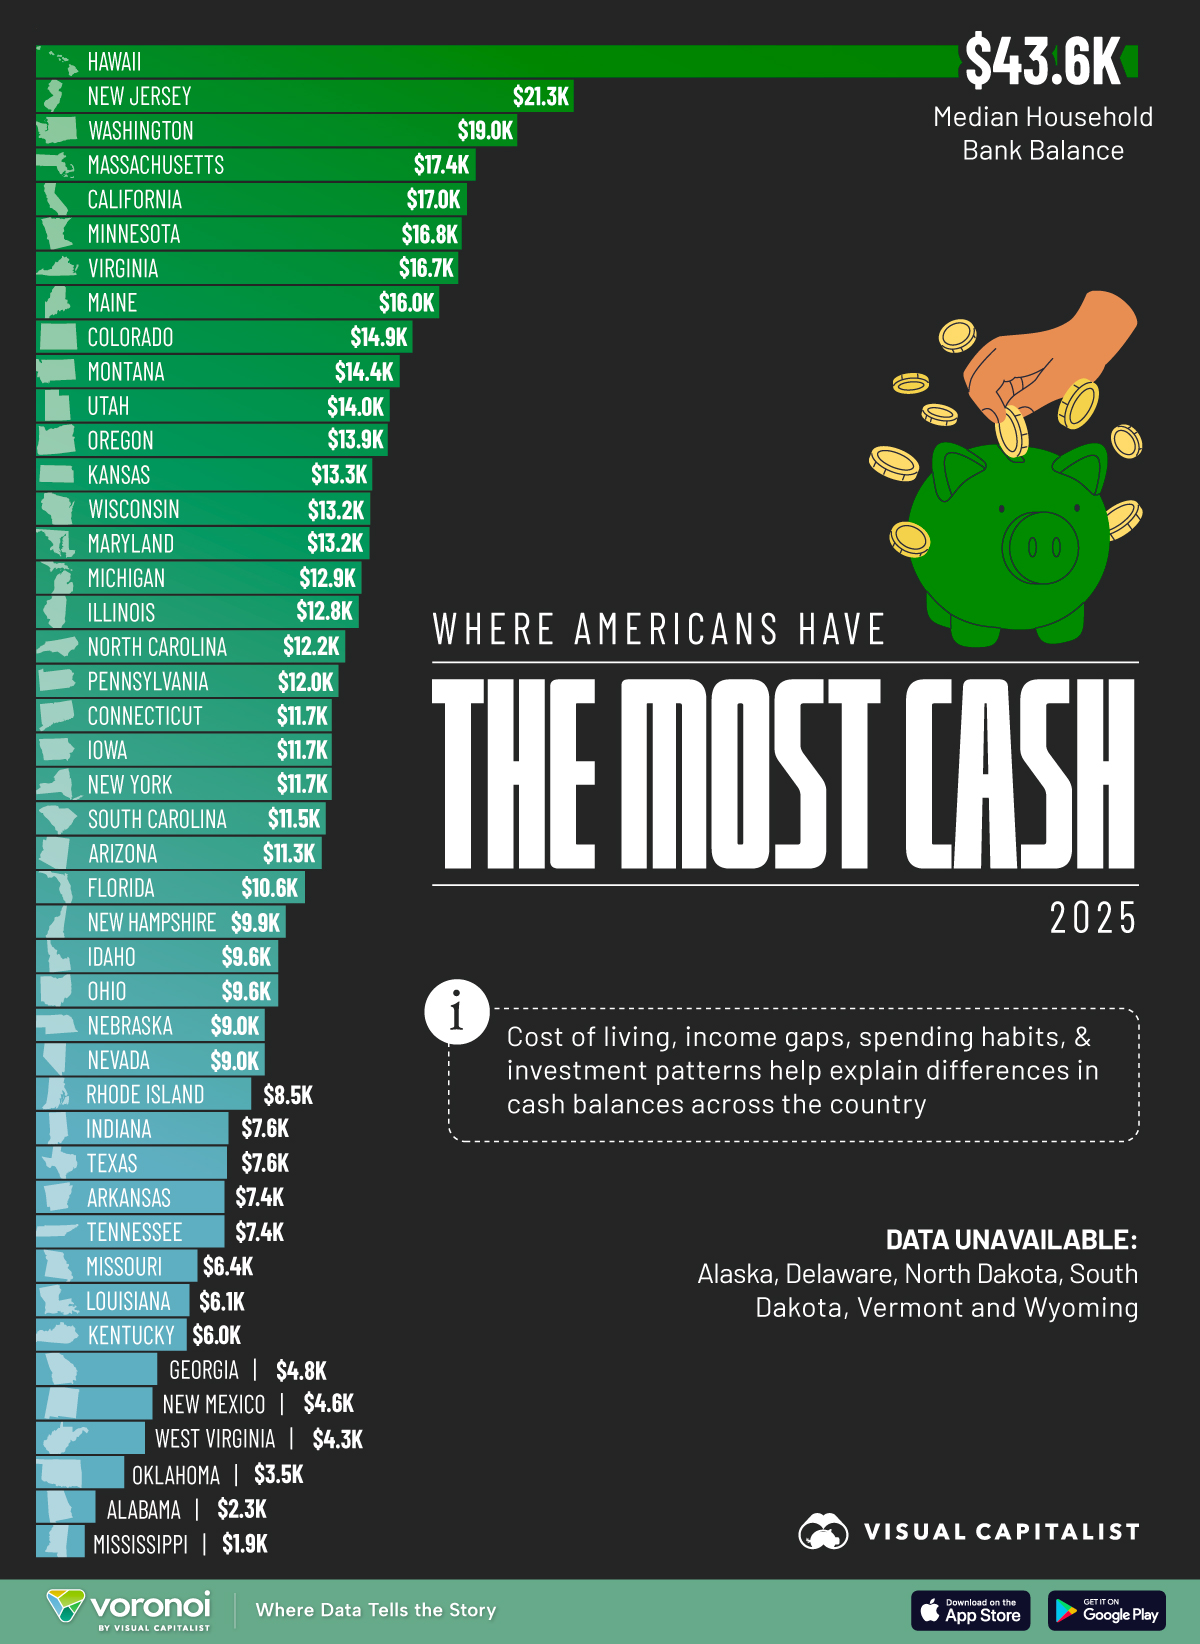
- Households in Hawaii have the most cash in the bank at $43,600.
- In contrast, the median bank balance in Mississippi is about $2,000.
In times of economic uncertainty, cash is king.
But where do Americans have the most cash in the bank?
Personal finance advisers SmartAsset analyzed median bank deposit data from the Bureau of Labor Statistics. The latest government figures are from 2022, and a 6.34% inflation rate was applied to convert those figures into 2024 dollars.
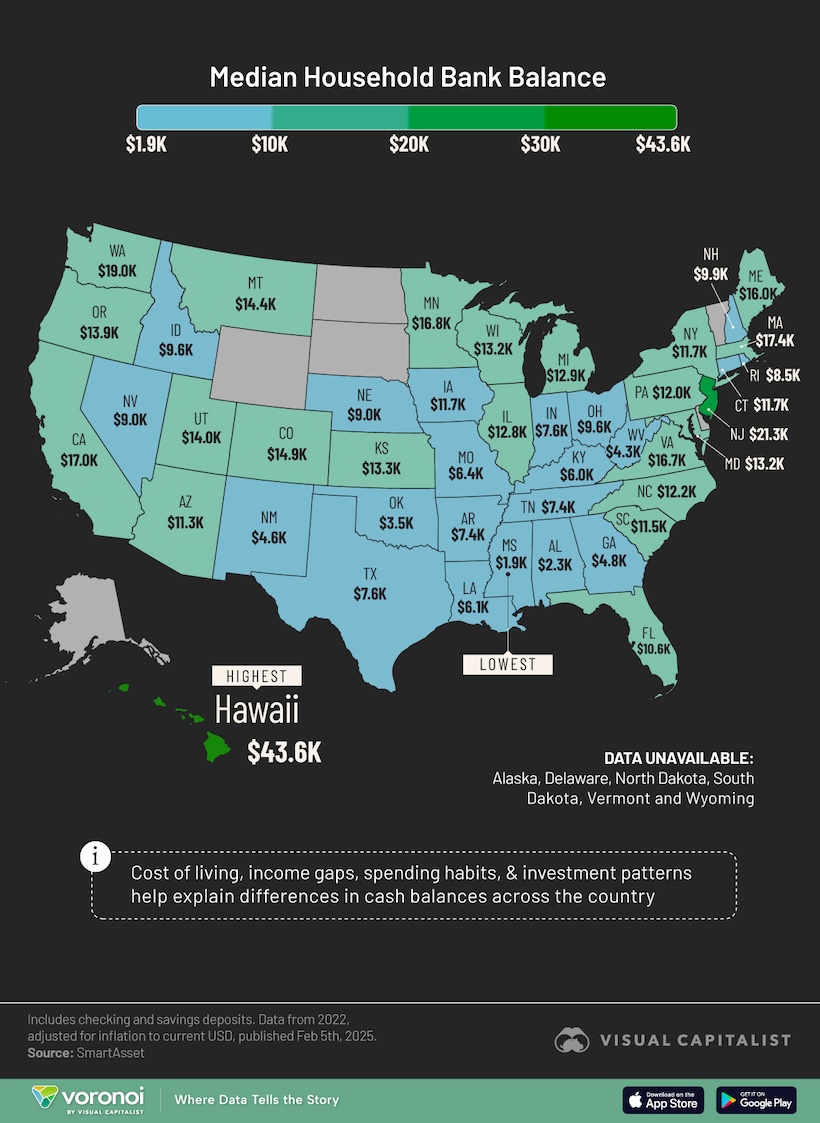
This median bank balance number visualized includes checking and savings deposits. Data is unavailable for six states: Alaska, Delaware, North Dakota, South Dakota, Vermont and Wyoming.
Mapped: Cash in the Bank in Every U.S. State
![]() See this visualization first on the Voronoi app.
See this visualization first on the Voronoi app.
Households in Hawaii have the highest median bank balance at $43,600. In contrast, households in Mississippi hold about $2,000 in the bank.
| Rank | State | State Code | Median Household Bank Balance |
|---|---|---|---|
| 1 | Hawaii | HI | $43,599 |
| 2 | New Jersey | NJ | $21,268 |
| 3 | Washington | WA | $19,035 |
| 4 | Massachusetts | MA | $17,387 |
| 5 | California | CA | $17,046 |
| 6 | Minnesota | MN | $16,834 |
| 7 | Virginia | VA | $16,695 |
| 8 | Maine | ME | $15,951 |
| 9 | Colorado | CO | $14,888 |
| 10 | Montana | MT | $14,388 |
| 11 | Utah | UT | $13,984 |
| 12 | Oregon | OR | $13,909 |
| 13 | Kansas | KS | $13,293 |
| 14 | Wisconsin | WI | $13,218 |
| 15 | Maryland | MD | $13,186 |
| 16 | Michigan | MI | $12,867 |
| 17 | Illinois | IL | $12,761 |
| 18 | North Carolina | NC | $12,229 |
| 19 | Pennsylvania | PA | $11,963 |
| 20 | Connecticut | CT | $11,697 |
| 21 | Iowa | IA | $11,697 |
| 22 | New York | NY | $11,697 |
| 23 | South Carolina | SC | $11,453 |
| 24 | Arizona | AZ | $11,293 |
| 25 | Florida | FL | $10,634 |
| 26 | New Hampshire | NH | $9,873 |
| 27 | Idaho | ID | $9,571 |
| 28 | Ohio | OH | $9,571 |
| 29 | Nebraska | NE | $9,039 |
| 30 | Nevada | NV | $9,039 |
| 31 | Rhode Island | RI | $8,507 |
| 32 | Indiana | IN | $7,603 |
| 33 | Texas | TX | $7,550 |
| 34 | Arkansas | AR | $7,444 |
| 35 | Tennessee | TN | $7,444 |
| 36 | Missouri | MO | $6,380 |
| 37 | Louisiana | LA | $6,061 |
| 38 | Kentucky | KY | $5,955 |
| 39 | Georgia | GA | $4,785 |
| 40 | New Mexico | NM | $4,594 |
| 41 | West Virginia | WV | $4,307 |
| 42 | Oklahoma | OK | $3,477 |
| 43 | Alabama | AL | $2,339 |
| 44 | Mississippi | MS | $1,914 |
While households in states with large economies (California, Florida, Washington) do tend to have more money in the bank, Texas and New York both buck the trend.
Instead, cross-referencing this map with an earlier visualization on median incomes offers the most correlation. Households in wealthier states tend to have more in the bank.
For example, Hawaii’s economy ranks 38th in the country. However it also has some seriously wealthy residents. About one in 10 Hawaiian households are millionaires. The state’s median income ($142,000) is only second after DC.
On the other hand, New York City is home to the most millionaires in the country, but the state’s median bank balance ranks 22nd.
This could indicate many things: significant wealth disparity in the state, more spending, or also that New Yorkers are investing their savings.
Meanwhile, Southern states tend to hold less cash in the bank. These same clusters of states also have a higher share of residents under the poverty threshold.
Learn More on the Voronoi App ![]()
If these median bank balances have you worried, it’s worth keeping things in perspective. Check out: All the World’s Money Divided Amongst 8 Billion People to see how wealth concentration is skewed on a global scale. And why the average person has far less than you might think.